• Please visit and share your knowledge at our sister communities:
  • If you have not, please join our official Homebrewing Facebook Group!

    Homebrewing Facebook Group

What's the most baking soda you ever added to a dark beer recipes mash?

Homebrew Talk

Help Support Homebrew Talk:

This site may earn a commission from merchant affiliate links, including eBay, Amazon, and others.
And a purist like A.J. (who stamps out error at the level of less than 1% to 2%) will likely reject that color can validly be used at all due to its poor 'R' value of correlation inevitably leading to errors far more massive than 1% to 2%.
Well that is the case, isn't it? I fear you are, as many people do, confusing correlation and causation. FBI data shows definite correlation between the population of certain ethnic groups and the murder rate in a state. If I discover that more people from one of those groups are moving to the state should I go to the chief of police and tell him is going to need to hire x more homicide detectives?

This should be inevitably true for all of us as well,
Obviously. No one has shown that color is a good predictor of malt properties and until someone does, then we will have to accept it.


so it clearly does not involve seeing beyond what is already known,
No it doesn't. What's the point here?

but if in fact malt color is to be completely left out of the picture (as A.J. stated above for his graph),[/QUOTE] No, A.J. didn't state that for his graph. He didn't sort or designate his data by color when he made it. It's implication is, of course, that pHDI by itself is going to be a bad predictor of acidity just as the number of Rongovians moving to Itsiburg is not likely to be a good predictor of the murder rate. But when the question about color was asked A.J. opined that one might well find that were the points in sufficient number and designated by color that there one might find tighter correlations among the groups. It seems that A.J.'s posts aren't being read.

then all software intended for the un-testing and unawares masses must be invalidated thereby, regardless of its generation or complexity. This is the essential point that I'm making.
I'm afraid I can't see any point here at all. In fact I can't even figure out what you are trying to say.

The point that coders such as yourself are deluding everyone (including yourselves) into somehow believing that such genius will in fact hit a target that no one has ever seen before. If color is involved, then massive error potential (and reality) is inevitable. And in the real world pH targets will be missed.
The man has shown no evidence of delusion. He has merely recognized that the offering of brewing related functions in an Excel Add In has great potential to simplify spreadsheet preparation by anyone and that elimination of the computational errors inherent in Gen I programs is of potential benefit to the users of such spreadsheets. I understand, being of the same ethnic background as he, how he might get a little carried away by the genius bit.

Did you notice that A.J.'s averaging line passes through the center-line data for exactly none of the malts he tested on a color free (color independent) basis?
That's not an averaging line. It's a LLS fit to the data. Should it go through the center of one of the circles? I can make it go through one if you like but it wouldn't be LS any more.


Therefore even if color is stamped out of the picture entirely by introducing and replacing color by "averaging" data for hundreds of past tested malts, correlation to real world of today malts will be found to be faulty if one does not "properly and validly" test every malt every time it is purchased....
Statements like this only make it clear that you do not understand what we are trying to do here. Until you do I am afraid I cannot be of much help.

And if malts can have anywhere from 35 to 60+ mEq/Kg acidity for a DI_pH of 4.7, then how can you know that your roughly 300-350L roasted malt lot will be 35 or 60+ (or anywhere inbetween) acidic without independently testing it (beyond simply taking a DI_pH)....
You can't unless testing by someone has revealed that something or things you know (such as type, maltster, cultivar, batch number) lets you look up pHDI, a1, a2 and a3.


So not only is color an invalid criteria, but so also is DI_pH alone,
Correct.


and so also will be the averaging of a multiplicity of actual "past" data points.
What is it that is being averaged here?


Validity at the A.J. level of approaching zero error can only come from testing at a lab control level of expertise,
Perhaps the most important thing you are missing is that no model is of any worth unless it is validated against testing. The more accurate the tests, of course, the better the model. The best results would come from a maltsters or brewers lab. No measurements no, models.

and real world brewers this side of breweries will not be likely to undertake this, or even understand how to undertake it properly if they do decide to undertake it.
That's true. Thus to get reliable malt data we must rely on the few of us that are willing to undertake the measurement protocols. No measurements, no models.


Most of us can't even trust our own pH meter readings, let alone do and then trust titration readings.
There is an art to pH measurement and it takes experience to acquire it. The interesting thing is that you will know when you have acquired it. A brewer taking his Hach pHPro+ out of the box doesn't have it. Joe Walts took all his measurements with a pH Pro+ so it is quite possible for anyone who wants to to do it.


So if the criteria of excellence requires both a precise DI_pH meter reading, and a then a tri-fold set of titration readings, and we can't even believe our own pH meters, then most of us are dead in the water even if we do intend to test....
True. That's why you have to rely on others to do the measurements. No measurements, no model. But this has nothing to do with GenI, GenII. In either case you have to model the malt and that has to be done by measurement. No measurement, no model. How can you possibly expect to predict the pH of a mash if you have made no measurements on the malts? The GenII software accepts any model.
 
Last edited:
Short version: The validity of A.J.'s software is entirely dependent upon a multiplicity of testing procedures, all carried out with the confidence of precision accuracy, and all carried out for each and every malt we purchase, each and every time we purchase it.
Totally, completely, entirely and absolutely incorrect. A.J.'s software depends only the chemistry of acids and bases - it has nothing to do with the accuracies of malt models. It correctly calculates based on malt and water parameters you pass to it. If you want those calculations to be meaningful those parameters must closely represent the water and malt being used and that data will ultimately be based on measurements. Based on multiple measurements of my water's alkalinity I know what comes out of the tap on a given day will be between 1 and 2.2 mEq/L alkalinity. I can tell the software that the alkalinity is 1.6 and I can tell it that the chocolate malt I am using has the properties of the chocolate malt that Kai measured way back when and it will give me an answer and probably not a bad one. Or I can measure the alkalinity of the water and I can measure the properties of the malt, feed those in and get another answer. Which will be the better answer? In other words, the software is not in question. It is awfully solid. The quality of the reusult I get depends only on the quality of the data I feed it. This basic concept seems to be way beyond you but you really must understand it if you hope to understand what the Gen II people are up to.


We have already witnessed one real world case where A.J.'s software solution failed to match a brewers real world deep roasted recipe brewing experience.
Well now you are putting me in the position where it seems I must defend "A.J's software" but there is no need. If you can't see the virtues of the Gen II approach that's really your loss and while I suppose my inclination to proselytize is a strong as anyone's I realize its a waste of time. The only reason I am wasting the time here is because I want as many people as possible to be exposed to the Gen II approach as possible (O.K. - that's proselytizing). The word you incorrectly applied here is "failed". In a correct reporting of the facts you would replace "failed to " with "didn't". In fact you really have no idea whether the failure was in the software or in the poster's failure to measure pH properly. Now as this software is still very beta it could be either or something altogether different such as adulturated sodium bicarbonate or a typographical error in a reported mass. In my experience where a brewer gets a pH reading that doesn't make sense, it's the pH meter reading that is the problem but that doesn't mean that was the case here.

And also several testimonies to mash pH's at the measured level of 4.8 to 4.9 pH pre-adjustment, wherein A.J.'s model presumably predicts closer to mashing straight-up at (give or take) 5.4 pH for these or similar recipes.
As I never applied my "model" to any one of these testimonies I have no idea as to what it would show. I have no problem with accepting that a mix of lots of acidic malts can lead to pH's that low.

[Edit: perhaps I do. I can get to pH 4.92 by mashing Maris Otter and a hypothetical malt with pHDI = 4.48 (the lowest I have seen excluding Sauermalz) and linear buffering of -90 mEq/kg•pH (the highest I have ever seen excluding sauermalz) in very hard water. It takes 43% of that stuff to get the pH this low so again I am suspicious of the pH readings but again, that doesn't prove anything.]

So there are already a couple cracks appearing within the complexity of A.J.'s ointment
No, there are no cracks in my ointment (..one shilling the box. Allow me to sell you a couple?") And it's not complex. Just a handful of simple functions. When the code mavens put it together into a bullet proof, attractive, multiplatform package (if any of them ever do), then it will become complex.

for which I'm continually working to better resolve the issues).
To acheive success in this you are going to have to better understand the fundamentals.
 
Last edited:
A.J, what I should far more appropriately have said is that you have publicly released tools that others will now potentially develop into mash pH predicting tools that will be fused with and morphed into models which to one degree or another inevitably must fall back upon color, malt class, acidity estimating slopes (linear or otherwise), the averaging of malt data, and DI_pH's. Otherwise how will they ever have the potential to make your tools become available for day to day use by the unawares (as to chemical science and mathematics) brewing masses?

I.E., that your tools will potentially be abused and somewhat mistreated by those coders who will then lean upon your status as a god of brewing science to lend credence to what has become of them in the hands of said others. Just as I have potentially done with some of the earlier tools you have given to us.

And of course I'm saying that despite your full confidence in your model, it must gain credence by standing the test of time against hard data from the real world experience of home brewers, just as any other model must do. But in order to do so, it must be compromised by others, as it must be simplified for the brewing masses, who are only somewhat familiar with generalized malt classifications and malt colors, and who have little to no understanding of DI-pH's, let alone titrations, and also have little to no understanding of the variabilities inherent in malts from lot to lot, let alone from maltster to maltster. You yourself admitted that many of those among whom I speak still believe in the power of a particular gen 1 program to hit mash pH's to 0.01 pH precision nigh on all the time (despite having undergone revision upon revision, wherein one revision predicts things differently than do others, and users are still using several year old versions and yet still all of them, using the old or the new, are somehow confident of getting 0.01 mash pH accuracy). They simply have not got a clue. How will your software change this?
 
Last edited:
They aren't publicly released at this point though I wouldn't refuse them to anyone that asked.

Yes, I suppose there is potential for misuse but that's out of my hands and that potential would not prevent me from releasing them in any case. De-deification would be, IMO, a better approach.

Remember that I don't really have a model. I am simply using one long standing, widely accepted method for solving acid base problems that you will find in many chemistry books. What would have to be tested is a developers means of passing malt parameters to the computation "engine". If, in response to a user selection of "Crisp Maris Otter" as a malt type he passes parameters more representative of Muntons Maris Otter then there will be noticeable error. This would presumably be reported to him and he would correct his program but no one would question Newton-Raphson or the proton condition method based on such a goof.
 
Last edited:
No, it isn't backing soda, but what might the calculator have predicted for the following?

Grist:
75.0% MO 6 EBC
12.5% Flaked Barley 3 EBC
4.25% Flaked Oats 2 EBC
6.00% Roast Barley 1300 EBC
2.25% Chocolate Malt 950 EBC

Mash Liquor 2.25L/kg. 83ppm Ca, 35 Mg. 29 Na, SO4 125, Chloride 144, Alkalinity 80 as CaCO3.

Mash pH stable at 30 minutes 5.40

The above is not the complete recipe, just the mash, nor was the sparge liquor make-up that used for the mash.

Thus far I have found predictive software of no practical use. However, reading the posts on zero effective alkalinity has me wondering if this might be a turning point.
 
I think its time for another sanity check. Up at 4:00 AM this morning hoping to see a few of Perseids meteors which never actually showed up it struck me. It involves brewing the delicious beer we've come to love and enjoy. And having two or more different approaches to brewing it. But then what's even better I remembered the words of John Palmer when discussing IBU prediction formulas some years ago. Something no living homebrewer I've ever heard seen talked to or read about has ever had tested.

By changing 'IBU' in John's quote to 'mash pH prediction' the words take on a new relevancy as they pertain to our Gen I/Gen II conversation.

"Mash pH prediction numbers are really an approximation. Each brew is unique; the variables for individual conditions, i.e. vigor of the boil, wort chemistry, or for losses during fermentation, are just too hard to get a handle on from the meager amount of published data available. Then why do we bother, you ask? Because if we are all working from the same model and using roughly the same numbers, then we will all be in the same ballpark and can compare our beers without too much error. Plus, when the actual mash pH prediction numbers are measured in the lab, these models are shown to be pretty close." ~mostly all John Palmer really (How To Brew)

First Observation: The Gen I approach is based entirely on grain color. Where darker grains (lower pH) like those in a Porter require little or no acid in the mash. While lighter grains (higher pH) like those used in a Kolsch or Pilsner require acid to hit a preferred mash pH. Grain color information is readily available for us brewers to use. Even then there are outliers. Grains that are roasted for a specific flavor are not held to a standard color these present prediction challenges to all Gen I type calculations.

Second observation: The Gen II approach relies on the DI pH and buffering strength of each grain. This is where most people's eyes begin to glaze over not mine but most of the brewers I talk to. The challenge here is getting accurate DI pH values of every grain from all maltsters or doing the titration testing yourself. Accurate grain DI pH and buffering data is crazy hard to come by and beyond the reach of most brewers. Similar to the same challenges John mentions about having a lab confirm the actual IBU or as I interject mash pH prediction values of our beer. Which is still true to this day for mash pH and IBU predictions. A lab confirmation of predicted mash pH numbers compared to real world actual mash pH numbers to see where we stand is not being done by anyone anywhere anytime soon.

Final Observation: Then there are the actual recorded mash pH values taken over years of brewing different styles of beer. Those are the real mash pH values because to me recording an accurate mash pH value is easy. Most of the posts I read are complaints about differences in mash pH predictions and actual mash pH values that are within ~0.30 pH points. I think the homebrew community is better served when everyone plays by the same set of rules. Or in this case formulas.
 
Last edited:
No, it isn't backing soda, but what might the calculator have predicted for the following?

Grist:
75.0% MO 6 EBC
12.5% Flaked Barley 3 EBC
4.25% Flaked Oats 2 EBC
6.00% Roast Barley 1300 EBC
2.25% Chocolate Malt 950 EBC

Mash Liquor 2.25L/kg. 83ppm Ca, 35 Mg. 29 Na, SO4 125, Chloride 144, Alkalinity 80 as CaCO3.

Mash pH stable at 30 minutes 5.40

The above is not the complete recipe, just the mash, nor was the sparge liquor make-up that used for the mash.

Thus far I have found predictive software of no practical use. However, reading the posts on zero effective alkalinity has me wondering if this might be a turning point.

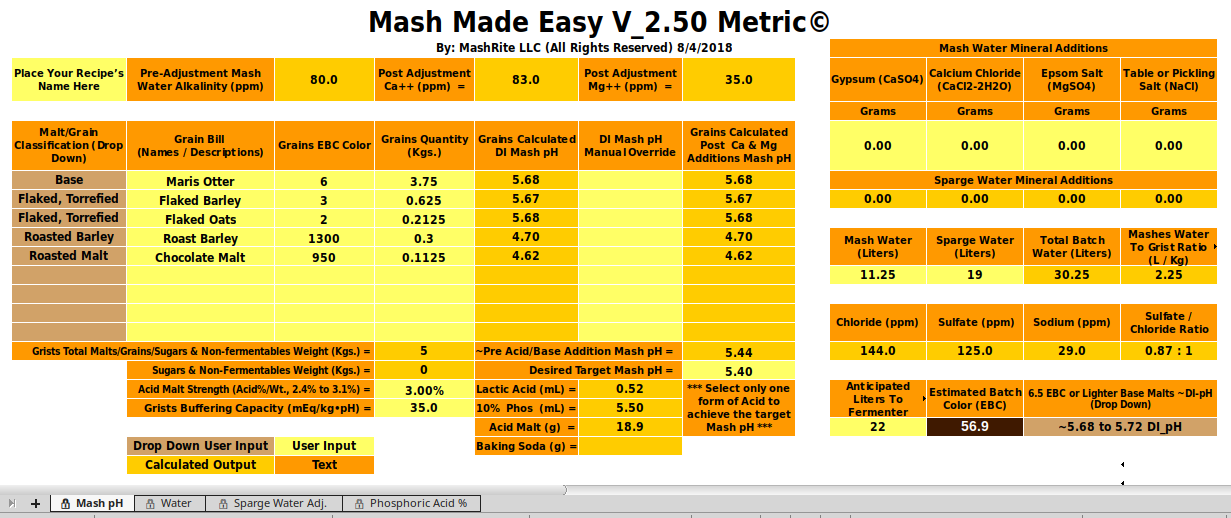
I don't know what A.J.'s calculator would predict (since even though I have a copy it won't function in Linux), but the current released version 2.50 of 'Mash Made Easy Metric' predicts 5.44 as the pre-adjustment mash pH, as can be seen below:

Screenshot at 2018-08-12 15-37-25.png


FWIW, the current testing version (2.60, which I'm currently skeptical of) predicted 5.52 as the mash pH.
 
No, it isn't backing soda, but what might the calculator have predicted for the following?

Grist:
75.0% MO 6 EBC
12.5% Flaked Barley 3 EBC
4.25% Flaked Oats 2 EBC
6.00% Roast Barley 1300 EBC
2.25% Chocolate Malt 950 EBC

Mash Liquor 2.25L/kg. 83ppm Ca, 35 Mg. 29 Na, SO4 125, Chloride 144, Alkalinity 80 as CaCO3.

Mash pH stable at 30 minutes 5.40
That depends on what you feed it. For best results you would want malt parameters close to those of the actual malts you used. As the MO is 75% of the grist what you tell it about that is going to have more effect on the estimate than the other malts' inputs. Using malts I think are closest to what you specify I get 5.340 if I feed it measurements for Crisp MO and 5.425 if I feed it measurements for Munton's MO.

The above is not the complete recipe, just the mash, nor was the sparge liquor make-up that used for the mash.
Those predictions are for mash pH.


Thus far I have found predictive software of no practical use. However, reading the posts on zero effective alkalinity has me wondering if this might be a turning point.

Zero effective alkalinity makes you less dependent on predictive software.

The place I use predictive software 99% of the time is in responding to posts like this one. In my own brewing I know, without any software, where things are going to wind up. If I have a problem predictive software can be a powerful diagnostic too as, if properly done, it lets you see where all the protons flowed.
 
Last edited:
Second observation: The Gen II approach relies on the DI pH and buffering strength of each grain. This is where most people's eyes begin to glaze over not mine but most of the brewers I talk to.
That right there is the big problem. Why is this so hard to understand. If we are 5 miles from home and drive for 10 minutes at a speed of 0.5 mi/min we will be 10 miles from home at the end of 10 minutes . If we are at pH 5.6 with a malt that has buffering of -40 mEq/kg*pH and add 10 mEq/kg acid we will end up at pH 5.35.

The challenge here is getting accurate DI pH values of every grain from all maltsters or doing the titration testing yourself. Accurate grain DI pH and buffering data is crazy hard to come by and beyond the reach of most brewers.
I would have agreed with that statement this morning but then I read Riffe's paper. He put 6 mason jars with grain in a slow cooker, added water and measured pH. That's not so hard (he did make it hard on himself with this "fiducial grain" business but you don't have to do that. Use standard sulfuric acid/sodium hydroxide as your "fiducial grain" and you have malt data.


Final Observation:
Then there are the actual recorded mash pH values taken over years of brewing different styles of beer. Those are the real mash pH values because to me recording an accurate mash pH value easy.
Are they real mash pH values? It's only been a few years since we have had inexpensive but good pH meters and a focus on how to use them properly. Even though we have them now we still see lots of reports of pH readings that just can't happen. When I was starting out with pH meters I got lots of crazy readings to. It was quite a while before I could spot a fishy pH reading consistently.
 
Last edited:
I have a lot of reading to do this week and next to catch up on AJ and Riffe's publications and AJ's current voltmeter release. I haven't seen @RPIScotty posts in awhile I know he has been collecting data on malts too.
 
By looking at A.J.'s chart (above) and also perusing dmr's publication titled "A Homebrewing Perspective on Mash pH III" I was able to see where 4.24 to 4.30 is not the normal DI_pH range for typical 600L(ish) roast malts (as I had previously assumed), and by raising my DI_pH to more the norm for this deep color range and modifying my slope for this malt class accordingly I was able to cut out a lot of the need for baking soda in MME. Still waiting to test it on an upcoming robust Stout so my disbelief can be turned into belief. Now at as yet unreleased testing version 2.70.
 
You could always do a simple test mash with some sodium bicarbonate and samples of the dark malt. Just put a few grams of dark malt in each of a couple of jars, add nothing to the first, a pinch of NaHCO3 into the second, 2 pinches into the third, three pinches into the fourth etc. Add warm water and allow to stand for 30 min. Put into the fridge to cool and measure the pH of each. People with the voltmeter who try this can use the QAcid function to determine the number of protons absorbed by a pinch of bicarbonate at pH. It is mp*(QAcid(pH, 6.38,10.38) +1)/84 where mp is the mass of the pinch in mg and 84 is the molecular weight of sodium bicarbonate. For people without the voltmeter use the following table
pH mEq protons absorbed per gram
3.8 11.8735313
3.9 11.8654716
4 11.8553406
4.1 11.8426109
4.2 11.8266241
4.3 11.8065591
4.4 11.7813953
4.5 11.7498681
4.6 11.7104167
4.7 11.6611254
4.8 11.5996582
4.9 11.5231906
5 11.4283451
5.1 11.3111385
5.2 11.1669582
5.3 10.9905887
5.4 10.776318
5.5 10.5181595
5.6 10.2102254
5.7 9.8472788
5.8 9.42546456
5.9 8.94317105
6 8.40190998

which tells you how many mEq of protons are absorbed by 1 gram of NaHCO3 at the given pH values.

So I guess I am changing my advice to Riffe and others. If you want to get malt data on dark malts (where the effort is needed) pretty easily, use sodium bicarbonate as your 'fiducial grain'.
 
Last edited:
In my recipe folder I have 3 Stout recipes. Dry, Sweet, and Russian. Where formerly MME (as current released version 2.50) had these 3 recipes mashing in the 4.95 to 4.99 pH range (pre-adjustment), testing/tentative MME version 2.70 has the 3 of them mashing at around 5.26 to 5.30 pH (pre-adjustment). This for no-sparge BIAB, with Ca++ levels ranging from ~50 to ~75 ppm, which (due to no sparge, and all water added to the mash) is getting up there with the minerals on an mEq basis. Technically, per 2.70, they could all mash just fine straight up without any bicarb (baking soda) addition, sans that I'm aiming at 5.5 as my mash pH target. The impact this revision has made on all of my other recipes mash pH predictions is zilch to minimal at mid SRM's (wherein some of these recipes have small roast malt additions for color), and zilch at light SRM's (where no roast malts are present).

I'm still rather wary however, as it seems that hard data from Stout and Porter brewers (admittedly quite scant, and primarily as gleaned from this my "How Much Baking Soda..." thread, plus a bunch of web searching [which also turned up little measured data info]) is all pointing to a nominal mid 4.9(ish) mash pH range for this type of beer. Essentially I've yet to come across anyone this side of A.J. deLange who is counter to these types of recipes mashing in the ballpark 4.9 to 5.0 pH range. It would be nice to hear from 'dmr' as to his measured mash pH experience here. And ditto RPIScotty.
 
Last edited:
Are they real mash pH values? It's only been a few years since we have had inexpensive but good pH meters and a focus on how to use them properly. Even though we have them now we still see lots of reports of pH readings that just can't happen. When I was starting out with pH meters I got lots of crazy readings to. It was quite a while before I could spot a fishy pH reading consistently.
The approach to taking mash pH readings needs to be standardized in order to be useful to all.

Note: I use a RIMS mash system where the wort is circulated continuously during the entire time of the mash.

1) Treat the next day's RO brewing water with acid, salt and minerals as recommended by my mash pH prediction formulas.

2) The next morning mash the grains at the temperature and mash thickness entered into the prediction software.

3) At 20 minutes into the mash pull a wort sample set it aside in a covered glass to cool to room temperature.

4) Remove the pH meter from its storage solution and soak the bulb in pH bulb cleaner for 15 minutes then rinse with RO water.

5) Calibrate the pH meter then take a pH reading swirling the meter or the wort sample.

6) Wait until the pH reading remains stable for several minutes before recording the pH value.

7) Repeat steps 5 and 6 at least one more time then record and compare the actual pH reading to the predicted pH value.

To take this a step further have the mash samples validated by at least one other person trusted to follow a standardized approach to pH measurements.

Edit: @Silver_Is_Money in a Monday morning fog I mistakenly said not to swirl the sample during testing when in fact I should have said swirl the sample. See Hanna pH Sampling Guide. So I guess many of my own pH samples are also suspect now. https://hannainst.com/resources/ph/guides/ph-measurement-sop--hanna-instruments.pdf
 
Last edited:
I've added probably at most half a gram in a 5.5 gal batch, and only when I was at the same time adding enough other salts (CaCl primarily) that the pH dropped too much for my liking

Going off memory here but I think base tap water with seasonal variation calcium ~23-35ppm and alkalanity as CaCO3 90-110ppm.

With that most darker beers, no salts added, were falling in the 5.4-5.5 range on their own.
 
SB, I would add that for mash pH comparison purposes one also needs to know the Ca++ and Mg++ present within the mash water on a strict mEq basis. I'm of the (recent, as you all know) opinion that the old standard of ppm will simply not cut it here if accuracy is required. For example, 50 ppm of Ca++ within a 4.5 gallon mash is only half as much Ca++ as would be present within a 9 gallon mash. The pH shift due to the minerals for this example (which effectively presumes sparge vs. no-sparge) is sufficiently different to matter.
 
Last edited:
Going off memory here but I think base tap water with seasonal variation calcium ~23-35ppm and alkalanity as CaCO3 90-110ppm.

With that most darker beers, no salts added, were falling in the 5.4-5.5 range on their own.

Excellent info, but this is for a nominal 100 ppm of alkalinity in the mash water. That in and of itself would require (fully mash water volume dependent, just as for my Ca++ example as seen above) the addition of several grams of baking soda to bring distilled or RO mash water to the same alkalinity range. Your experience may actually fit the 4.9 to 5.0 pH mash camp data better than the 5.3 - 5.4 pH mash camp.

Edit: for a 4 gallon mash volume, the required baking soda added to distilled or RO water to hit 100 ppm alkalinity is 2.68 grams, and for an 8 gallon mash water volume the required baking soda is 5.36 grams (nominalized to a target of 5.4 pH, as per A.J., if I did this correctly).
 
Last edited:
5) Calibrate the pH meter then take a pH reading without swirling the meter or the wort sample.

Why no swirling? Back in my college and simultaneous lab tech days (way too many years ago to recall properly, though I'm going to attempt it anyway...) I seem to recall (there's that word again) doing pH terminating titrations with the pH probe immersed into a beaker sitting upon a stir bar plate, and with the stir bar present and swirling away during the titration. Perhaps I'm just old. I recall that color change indicator based titrations always required swirling, and perhaps I'm confusing the two. I also recall odd antimony tipped pH probes (as opposed to a permeable glass membrane) due to HF.
 
Last edited:
SB, I would add that for mash pH comparison purposes one also needs to know the Ca++ and Mg++ present within the mash water on a strict mEq basis. I'm of the (recent, as you all know) opinion that the old standard of ppm will simply not cut it here if accuracy is required. For example, 50 ppm of Ca++ within a 4.5 gallon mash is only half as much Ca++ as would be present within a 9 gallon mash. The pH shift due to the minerals for this example (which effectively presumes sparge vs. no-sparge) is sufficiently different to matter.
@Silver_Is_Money I'm not sure if you're referring to my 'standardized' approach to mash pH measurements or another post. If you're referring to the original Scenario1 (4.5-gallon and 9-gallon) validations then yes I am in agreement. I have to take a more strategic rather than tactical approach to implementing Gen II changes due to the complexities of my software platform and the amount of regression testing I feel will be needed.
 
Last edited:
@Silver_Is_Money I'm not sure if you're referring to my 'standardized' approach to mash pH measurements or another post. If you're referring to the original Scenario1 (4.5-gallon and 9-gallon) validations then yes I am in agreement. I have to take a more strategic rather than tactical approach to implementing Gen II changes due to the complexities of my software platform and the amount of regression testing If feel will be needed.

Yes, my comment was in response to your standard procedures (as you posted above) for pH measurement.
 
Why no swirling? Back in my college and simultaneous lab tech days (way too many years ago to recall properly, though I'm going to attempt it anyway...) I seem to recall (there's that word again) doing pH terminating titrations with the pH probe immersed into a beaker sitting upon a stir bar plate, and with the stir bar present and swirling away during the titration. Perhaps I'm just old. I recall that color change indicator based titrations always required swirling, and perhaps I'm confusing the two. I also recall odd antimony tipped pH probes (as opposed to a permeable glass membrane) due to HF.
Having bought a Hanna pH meter I frequently receive tips on how to care for and use pH meters from Micayla Plante of Hanna Instruments. If I can find the link to the video I will post it. The 'stirring effect' I think she that's what she called it. Stirring a sample does change your pH readings taken when not stirring the sample.
 
Last edited:
https://www.markson.com/lit/corp/faq/faqph.htm
https://vernier-videos.s3.amazonaws.com/training_html5/mp4/Acid-Base_Titration_(Computer).mp4

I believe that automated/computer linked titration kits generally recommend stirring. It probably comes down to the electrode and its requirements.
There is another reason I don't stir my samples. Having so many other brewday tasks leaves me with barely enough time to take pH samples. Let alone sit there and stir the wort for 10 minutes per sample. The other reason is not owning laboratory grade titration equipment. The point I'm trying to make is there are 'variables' even in the way pH sampling is done and reported.
 
Last edited:
Titrations are often conducted on a stir plate so that the reactants are fully distributed and the pH reading is more rapid. I don't believe there is a problem with some stirring.
 
SB, I would add that for mash pH comparison purposes one also needs to know the Ca++ and Mg++ present within the mash water on a strict mEq basis.

I'm not sure I'm following here. There is a fixed 50:1 relationship between hardness in ppm and in mEq/L. 200 ppm = 4 mEq/L, 150 ppm = 3 mEq/L etc. But calcium and magnesium numbers are seldom reported in ppm any more. A Ward Labs, report, for example may give the total hardness in ppm as CaCO3, but reports Ca++ and Mg++ as mg/L. Now mEq/L are much easier to work with and help in intuitive appreciation of what is happening when calculating the Kolbach phytin shift so you would want to convert Ca++ mg/L to mEq/L by dividing by 20 and Mg++ mg/L to mEq/L by dividing by 12.15. Note that total hardness converted to mEq/L may not equal the sum of Ca++ and Mg++ in mEq/L because the latter were probably determined by AAS and the former by titration. The titration picks up other divalent cations besides Ca++ and Mg++.

I'm of the (recent, as you all know) opinion that the old standard of ppm will simply not cut it here if accuracy is required. For example, 50 ppm of Ca++ within a 4.5 gallon mash is only half as much Ca++ as would be present within a 9 gallon mash. The pH shift due to the minerals for this example (which effectively presumes sparge vs. no-sparge) is sufficiently different to matter.
Again, I'm not following. Let's use metric to make the math easier. 45 L of water with calcium hardness of 50 ppm contains 1 mEq/L for a total of 45 mEq of Ca++. 90 L of water of calcium hardness contains 1 mEq/L Ca++ for a total of 90 mEq. That's twice as much calcium so we might think that twice as many protons would be released in reacting with a fixed amount of malt and that may indeed be the case but Kolbachs observation does not say anything about the thickness of the mash. Still it implies that 3.5 mEq Ca++, as it, in Kolbach's experience, appeared to neutralize 1 mEq of alkalinity, released 1 mEq of protons. That's the way I interpret it. Thus in the former case I would compute a proton surfeit of 45/3.5 mEq and in the latter 90/3.5. Now if the water is alkaline as well as being hard, some of those protons will go to neutralize the water's alkalinity and, depending on the malt's alkalinity, the pH shift might be less than expected.

The voltmeter spreadsheet shows clearly where all the protons come from and go to and this is one of its main virtues - i.e. it is a great teaching tool.
 
The voltmeter spreadsheet shows clearly where all the protons come from and go to and this is one of its main virtues - i.e. it is a great teaching tool.
I feel like a kid whose been given a shiny new toy to play with! A great teaching tool is an understatement. Thank you, AJ.
 
A.J., just a few weeks ago when I brought this up as the explanation as to why Kai's Brewer's Friend water calculator made noticeably different lactic acid adjustment predictions for different volumes of mash water at a given ppm concentration of Ca++, and you were initially of the opinion that you had discovered that he had clearly made an error, you suddenly realized that it was your error and you abruptly stood down and dismissed the issue stating that Kai (and by association myself) was (were) correct. You said, it was the calcium. Now you appear to be saying the exact opposite. This was (as I recall) a couple weeks before your revelation of the volt meter.

Edit, here are the links (though the initial issue appears several posts above these links):

https://www.homebrewtalk.com/forum/...-alkalinity-method.651983/page-2#post-8354809

https://www.homebrewtalk.com/forum/...-alkalinity-method.651983/page-2#post-8354815
 
Titrations are often conducted on a stir plate so that the reactants are fully distributed and the pH reading is more rapid. I don't believe there is a problem with some stirring.
@mabrungard I agree. I may have typed myself in the foot with this morning's post. But ultimately the pH value differences I've seen in my own testing between stirring and not stirring samples were limited to ~0.04 at best.
 
Edit: for a 4 gallon mash volume, the required baking soda added to distilled or RO water to hit 100 ppm alkalinity is 2.68 grams, and for an 8 gallon mash water volume the required baking soda is 5.36 grams (nominalized to a target of 5.4 pH, as per A.J., if I did this correctly).

I'm not understanding here. You would never want to make a water with 100 ppm alkalinity at pH 5.4 - mash pH. You can't do that with bicarbonate. It would take, for 4 gallons, 30.7 grams of sodium bicarbonate and 9.2 mL of 96% (concentrated) sulfuric acid to do that. If you have a need to neutralize acid malts, then just add the bicarbonate necessary to neutralize them to the water and don't worry about what the alkalinity is. This is equivalent to the 0 Effective Alkalinity method. You use water with 0 alkalinity and calculate the acid and base addition needed for the malt. If you want to synthesize water with 100 ppm alkalinity for some reason then do it shooting for 8.38 pH. Then you only need 2.53 grams of bicarbonate and no acid at all. And you don't wind up with acid cation in your beer (you may or may not want this).

The brewer needs to determine the proton surfeit he needs to cancel and then calculate the bicarbonate needed. He may add it to the mash or to the water (adding to the water gets it into action faster). The result will be the same. It really doesn't matter what the alkalinity of the water or its pH turn out to be. The voltmeter does not solve the problem "How much bicarbonate do I need to add to 45 gal of water to get alkaliity x at pH y?" because that's a problem a user will not need to solve. Of course I was able to solve it using the volmeter by invoking Solver but I don't think it's worth the trouble to write a function to do this.
 
Why no swirling? Back in my college and simultaneous lab tech days (way too many years ago to recall properly, though I'm going to attempt it anyway...) I seem to recall (there's that word again) doing pH terminating titrations with the pH probe immersed into a beaker sitting upon a stir bar plate, and with the stir bar present and swirling away during the titration. Perhaps I'm just old. I recall that color change indicator based titrations always required swirling, and perhaps I'm confusing the two. I also recall odd antimony tipped pH probes (as opposed to a permeable glass membrane) due to HF.

In a titration you need to stir things in order to disperse the titrant uniformly throughout the sample so that you measure all the analyte in the sample and not just that close to the end of the pipet. But there is the phenomenon of 'stirring error'. pH electrodes respond differently when solution is moving past bulb and junction than when they are not. You lick this problem either by stirring during calibration or by stirring after adding each aliquot of titrant and then lettin the meter settle down for a minute or so before accepting the reading. In other words, "read" the buffers in the same way you read the samples.
 

Latest posts

Back
Top