McKnuckle
Well-Known Member
Is Kunze's 5.2 cited at room temp or at mash temp...? If it's mash temp, then he's actually saying that 5.4 is ideal. I don't see it mentioned in the quoted text, but it's probably somewhere else in the book.

Is Kunze's 5.2 cited at room temp or at mash temp...? If it's mash temp, then he's actually saying that 5.4 is ideal. I don't see it mentioned in the quoted text, but it's probably somewhere else in the book.
Room temperature - 70 °F
I'd actually argue that unless you can cite the place where he says it's supposed to be room temp, that he is actually referring to mash temps. That was part of the problem until a few years ago, was that "5.2" was the quoted number but no one seemed to know (or indicate) whether that was at mash temps or room temp. I believe AJ, Kai, and others determined that all of the cited "5.2" references were for mash temps (which makes sense, since you're trying to target a specific environment for the mash itself you would expect the numbers to be relative to that mash).
If you're saying that he denotes that his 5.2 recommendation is at room temp, well then I can definitely second Bishop's concern that this is incorrect information. That would mean a mash pH of 5.0, which as we all know is quite low. I can't see any "brewing scientist" not knowing this, or recommending such a low range as the de facto standard.
All pH optima are reported as room temp. So it's 5.2 at room temp and 5.4 ish at mash temp, not the other way around.
Kai's posts on this topic support my statement.
John Palmer’s 1st edition of “How to Brew” states this:
“When you mash 100% base malt grist with distilled water, you will usually get a mash pH between 5.7-5.8. (Remember, the target is 5.1-5.5 pH.)”
In this sentence he mixes room temp and mash temp pH values. The 5.7-5.8 base malt pH is correct when seen as the pH of a room temperature mash sample while the 5.1-5.5 pH target is only correct when seen as a mash temp pH target with a conversion factor of 0.35. With the correction the room temp sample pH target range is 5.45 – 5.85, which is more correct.
And to answer the question that is most interesting to brewers, I believe that the optimal mash pH range is 5.3-5.5 for light beers and 5.4-5.6 for darker beers when testing a room temperature sample of the mash.
Completely 100% false.
I'm not sure if you're just trolling for argument's sake or if you're serious, but please stop posting bad information in here and treating it as fact.
As the temperature increases in water, there's an increase in its ability to ionize and so the concentration of H+ in solution will increase, and hence the pH will drop, not rise.
There is no way you can sit here and tell us any different. And for the record, "Kai's posts on this topic" certainly DO NOT support your statement. Here's a direct quote, emphasis added (taken from http://braukaiser.com/blog/blog/2011/03/02/about-ph-targets-and-temperature/):
This is not a disputed theory, this is hard scientific fact - the pH of a mash sample will rise as the temperature lowers.
And further down in the same post, he mentions the ideal range based on beer style:
So it just seems you are incorrect all around.


![Craft A Brew - Safale S-04 Dry Yeast - Fermentis - English Ale Dry Yeast - For English and American Ales and Hard Apple Ciders - Ingredients for Home Brewing - Beer Making Supplies - [1 Pack]](https://m.media-amazon.com/images/I/41fVGNh6JfL._SL500_.jpg)


The 0.35 reported by some sources is not correct. It's more like 0.2 per Kai and Strong.
So, RPIScotty got it backwards. And so did I, for a minute. But I think I've got it square now.
Meanwhile, Matt's discussion about subtracting 0.35 from 5.7-5.8 or whatever is a total misapplication of facts.
pH should always be measured at room temperature. That's a fact. I'm not going to cite sources, go look it up yourself.
...
All the while, I must be some kind of idiot because I choose to measure mash pH at 150 F instead of room temperature. I need to run some more experiments to see what the real differences are, haven't done that yet, but I will, eventually.
Mash pH of a 100% base malt in distilled water measured at room temperature will in fact be around 5.8. This was reported by Ray Daniels in Designing Great Beers.
Valid point, Bishop.This isn't always true. Different base malts have different buffering/acidifying capability and they don't all measure 5.8 in a distilled water mash. This is what makes predicting mash pH with software so challenging. It's not a constant even with the same grain line, it'll vary year to year and crop to crop.
Sounds right to me, D.Alright. Kids are washed and put in bed and I'm stationary.
I just want to say that I'm not here to argue for the sake of arguing or to try and be right. I love talking about beer. I think that if we take a second to get aligned that this could be a great discussion and very informative.
Let's lay out some talking points and see if we agree, and if we don't well know where we diverge and we can zero in on that. Can we agree on the following points:
1.) Room temperature pH measurements are an industry standard for measurement
2.) As such, when ranges and target values are quoted, they are at room temperature
3.) We can safely say that 5.2-5.6 encompasses the most common target values
Can we agree on these points?
I'm searching through the various forum posts, Kunze, Fix and DeClerck right now and if we can agree on the above points we can start to put a sort of narrative together that we can agree on.
I'll buy into that, I used to target 5.4.-5.5 as it produced my "best" beers as well. When I went to LOB, I found those same beers to be muddy.
Cool! So for those of us brewing the "normal American" way, we should perhaps indeed be aiming for 5.4-5.5. And if we should ever try the LODO method, then it makes sense to bring this down to 5.2. Very interesting. Thanks for sharing your experience between these brewing methods.
Sorry, I haven't comment on this but I am following. The 5.4/5.5 is mash pH or room temp pH? I'm trying to tie this to my bru n water sheet. I don't have a pH meter yet so I'm going with estimates at this point...
5.4-5.5 at room temperature. Measured directly in the mash at mash temperatures, the desired range should be closer to roughly 5.2-5.3 (and that, then, is what I shall aim for in the future).
For whatever else it's worth, I just made a porter where I measured 5.1 directly in the hot mash, and this porter is not at all acrid or acidic, not at all. It turned out great.
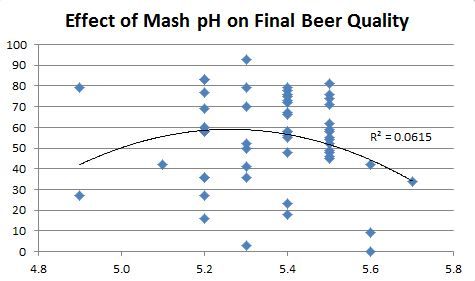
It looks like your peak success has come at pH 5.25. Not far from Scott's 5.2.

I'll tell you this much, if you need to raise your pH to avoid an acrid, thin and all together unpleasant beer, then you are treating the symptoms rather than the problem.
However, it would be foolish to apply that pH recommendation to all beers. As noted above, there are styles that clearly benefit from higher mashing pH. A single mashing pH specification is not appropriate in my opinion.
What meter are you using for a mash temp reading?
RPIScotty, I would like to point out that when you spoke about using a mash pH of 5.2, you were saying that the measurement was at room temperature. If that's the case, then your pH at mashing temperatures is in the 4.9 range, which is low.
I believe that the section on pH in Kunze's bit there is referring to pH measured at mashing temperatures. This is where things get a little sideways when referring to documentation on mash pH readings, unless the author of said work specifically states the temperature of the sample when measuring.
I'd like to clarify something that I may have overstated. A low mash PH in a beer with a significant proportion of roasted grains doesn't make the beer undrinkable. It does tend to give the perception of a thinner mouthfeel, and to my palate a sharp, dry and acrid note in the roasted flavors that I'd rather avoid.
While a mash pH of exactly 5.2 enhances enzyme activity there are other considerations. Beer flavor and mouthfeel are equally important in regards to formulating a recipe. Certain flavors can be enhanced by manipulating the wort pH, and other undesirable flavors may be enhanced if the pH is too low or too high. Hop bittering and perception is another consideration for certain styles of beer, and it is definitely impacted by wort pH, which is in turn influenced by mash pH.
Even though enzyme activity might not be 'optimal' at a slightly higher mash pH, it's still sufficient to convert the starches in the grain we're all working with.
Brewing is as much 'art' as it is 'science.' There may not be a cohesive, scientific reason that big roasty beers are perceived as 'better' with a higher mash pH; it just works out that way.
Your results may be different due to any number of factors. Less or different types of roasted malt in the grist, for one. Perhaps you prefer the dryer/sharper roast character. Could be any number of things.
Tell you what; when I hit the lottery I'll gather us all in a big 'beer lab' and we can run experiments until we're tired of them.


