So what does this tell us?
Fiirst, that one person bought two cheepies and they both worked for more than a year. Assuming the population probability of failure in that time to be 0.3 (30% - no claim that that is the number - just that user reports seem to indicate a number like that) the probability of 0 failures in a sample of 2 is (1 - 0.3)^2 = 0.49 or 49%. Even with a pretty high (IMO) failure rate about half of people who buy two will find neither fails in over a year. And the probability of failure of at least one is 2*(0.3)*(0.7) = 0.42 (43%) and of two is (0.3)^3 = 0.09 or 9%. Thus, in statistical terms, we have very little confidence that the failure rate is less than 30%. By comparison, if we tested 10 meters and had no failures the probability of that event would be (1 - 0.3)^10 = 0.04 (4%) and we would be able to say, at less than the 5% confidence level, that the meters have better reliability than 30%. Five percent is often the minimum acceptable confidence level. Thus the survival of two meters for more than a year doesn't tell us anything useful with respect to the hypothesis that these are really reliable. One would need to do this test on at least 10. And then, of course, we'd complain that 5% isn't a very comfortable confidence level but that's the nature of statistics folks!
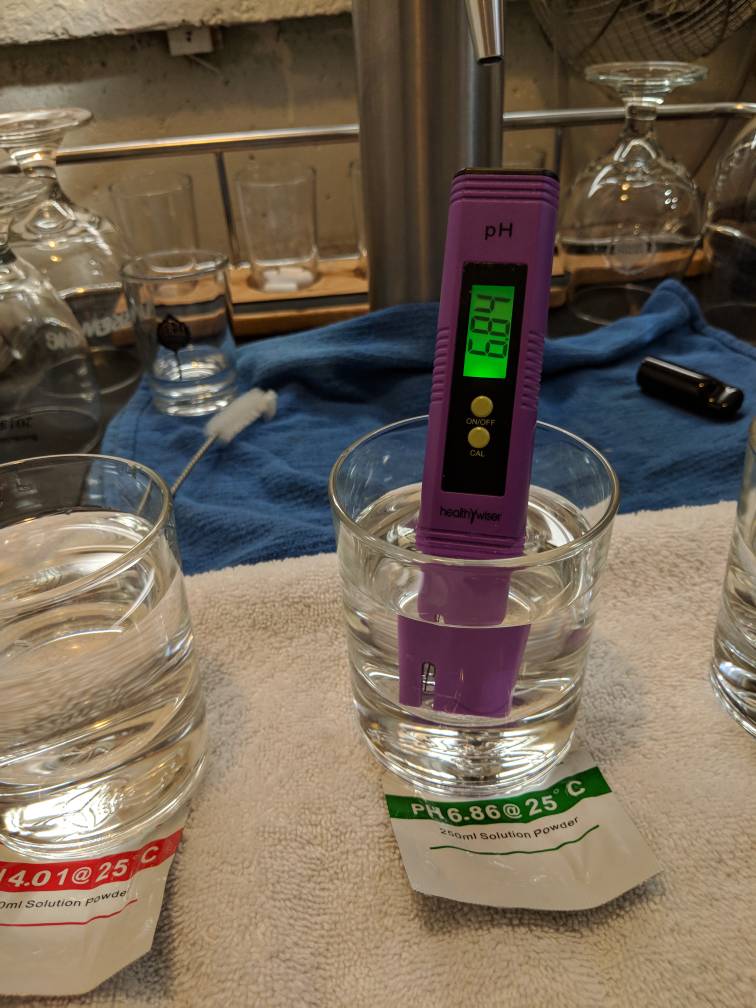
Second, that the apparent accuracy of these meters would be unacceptable to many brewers. While one can no more draw any statistically significant information as to whether the population of these meters meet their specified accuracy from a sample of two than he can about reliability, it may be helpful to some to look into what these readings tell us about the meters assuming they do meet their specified accuracy of 0.1 pH rms. The meter reads a voltage and temperature. Both of these are corrupted by noise and bias and one of the differences between cheap and more expensive meters is in processing done to minimize the effects of the noise with the biases taken out by calibration (that's what the buffer stuff is all about). The meter takes the measured voltage and temperature and sticks them into an equation which produces a number. This number is then rounded (which introduces 'quantizing noise') and the rounded number displayed. The quantizing noise is, in a good system, about 10 or more dB below the other noises so it doesn't distort the reading. The quantizing noise for an 0.1 precision display is 0.029 pH and this is 10.7dB below the stated accuracy of these cheapie meters which is 0.1 pH. For the Milwaukee meter the quantizing noise is around 0.0029 pH which is 17 db below the specified accuracy of 0.02 pH. Both meters are well designed in this regard. So we accept that the meters both read and display, unencumbered by quatizing noise, the actual pH with the readings corrupted only by the random noises as accurately described by their accuracy specifications (0.1 and 0.02). This means that what the display says isn't the actual, true, pH but something 'close' to it with what close means depending on the accuracy. The meter reads the most likely pH but other pH's are possible.
The curves below show the distribution of probable actual pH's from the two meters given their readings. The most likely pH's are at the 0.5 (median, 50%) level but the distributions of the probable actual pH's about that point are quite different. Looking first at the Milwaukee curves we see that the probable actual pH will be above between 5.44 in 10% of measurements where the meter reads 5.43 and below 5.46 in 90% of measurements so we conclude 5.44 < pH < 5.46 80% of the time. The numbers from the cheapie meters are 5.37 < pH < 5.62 in 80% of measurements.
Now whether that spread is acceptable or not depends entirely on the user's perspective which, in turn, depends on what he is trying to do. If all he cares about is getting his mash into the 5.4 - 5.6 range then likely it is. If he's trying to see if a difference in mash pH between 5.4 and 5.5 makes a perceptible difference in his beer then clearly it isn't.


![Craft A Brew - Safale BE-256 Yeast - Fermentis - Belgian Ale Dry Yeast - For Belgian & Strong Ales - Ingredients for Home Brewing - Beer Making Supplies - [3 Pack]](https://m.media-amazon.com/images/I/51bcKEwQmWL._SL500_.jpg)