The worlds easiest mash pH adjustment assistant method?

Homebrew Talk - Beer, Wine, Mead, & Cider Brewing Discussion Forum

Help Support Homebrew Talk - Beer, Wine, Mead, & Cider Brewing Discussion Forum:

This site may earn a commission from merchant affiliate links, including eBay, Amazon, and others.

Silver_Is_Money

Larry Sayre, Developer of 'Mash Made Easy'
Joined
Dec 31, 2016
Messages
6,452
Reaction score
2,209
Location
N/E Ohio
Make your own simple "Ballpark" mash pH assistant software as follows. The three formulas required are highlighted. Follow all 6 listed steps.
NOTE #1: It won't possibly be as good as any respectable mash pH assistant software, but if "Close Enough For Government Work" is OK by you, then this might just be for you. You can do this on paper with a hand held calculator, or make a quick spreadsheet out of it.
NOTE #2: No effort was made to factor in pH drop due to mineralization. Consider this method ballpark OK for moderate mineralization, and tweak as you see fit. No guarantees expressed or implied.

Step 1: Pick pH_T (your desired Target mash pH, this is often 5.4 or 5.5)
Step 2: Guess your beers final SRM color (whereby: EBC/1.97 = SRM)
Step 3: Determine your grists weight in Kg. (whereby: Lbs./2.2 ~= Kg.)

Step 4: Calculate the anticipated pre-adjustment mash pH (pH_M).
pH_M = 5.92-0.035*SRM+0.0003*SRM^2 (whereby * = multiply, and ^2 = Squared)

Step 5: Calculate the grists mEq's of acid or base with respect to your desired mash pH target
mEq's = (pH_M - pH_T)*34*Kg_grist

Step 6: Calculate mL's of Lactic Acid or Grams of Baking Soda to be added to your mash water
(NOTE #3: if the mEq's calculated in step 5 are positive, then add the calculated adjustment as mL's of Lactic Acid, but if the mEq's are negative, then add the adjustment as grams of Baking Soda)
(mL's or Grams of adjustment to add to your mash water to hit your target mash pH_T) = ABS(mEq's/11.7)
(whereby ABS = Absolute Value)

Disclaimer: On display here is Covid-19 boredom at its finest. No guarantees. All bets are off as to actual technical level precision. "Close enough for government work" is left up to you to decide. Don't laugh too loud at, or kill the messenger developer please. Rather than laugh at, publicly humiliate, or online kill, please modify to suit, trash, or simply ignore as you see fit. I'm fully aware that mash pH adjustment based upon SRM color has been generally considered a weak method. Judge for yourself how weak. But be civil.
 
Last edited:
First enhancement. Time to account for water with alkalinity (in mg/L or ppm, and as CaCO3):

(Mash Water Volume in Liters)*(mg/L Alkalinity)/50 = Alkalinity mEq's
(whereby: gallons/3.7854 = Liters)

Add Alkalinity derived mEq's to grist derived mEq's above in step #5 and then proceed to step #6.
 
Second enhancement. Time to account for the mash waters Calcium and Magnesium mEq's

(Mash Water Volume in Liters)*[(mg/L_Ca)/20/3.5 +(mg/L_Mg)/12.15/7)] = mEq's from Ca and Mg

Subtract calcium and magnesium derived mEq's from grist derived mEq's above in step #5 and then proceed to step #6.
 
This is an interesting exercise. And it looks like someone who knows little/nothing about mash pH could come away substantially smarter. So kudos on that, especially if that's the point!

But as I see it, it will be obsolete (for serious use) out of the box as long as SRM is used to compute the grist's acid contribution. There's a reason J. Palmer winces a little when anyone brings up his old nomographs/sheet, i.e. where you get your color from makes all the difference. I do note that you mentioned SRM is a weak method. I'm not sure why anyone would want to build a modern sheet using it (besides educational purposes), knowing there's a better way, and several canned options out there, including your own. (ETA: ...which would also be easier than rolling their own.)

As an aside, I remember trying to convince a friend, about 10 years ago, that he really needed to stop using an SRM based model (I forget who's). He was so attached to it that even when he started using a more advanced one, he would run both of them and make sure that his predicted pH from each model was somewhere between 5.2 and 5.6, even if that meant neither targeted the pH he would prefer. He called it "satisfying both models." I told him the models exist to satisfy him and not the other way around. He would laugh about it now, but he was totally obstinate back then.
 
This is indeed an entry level tool, intended to be quick and easy. But don't count it out or brush it off completely until, as "they" say, the tires have been kicked. Indeed it is a learning tool. It is intended to open the door of mash pH adjustment assistant methodology to those who thought this stuff to be mystically magic, or rocket science, or both. It is but a small leap from SRM to DI_pH, buffering, and individual grist component mEq's. But as it stands, there is abundant room for simple honing and tweaking and feather like "layering" whereby to realize output improvement and precision from an SRM approach.

I actually suggested an even easier core model 'outline' once on this forum based entirely upon Weyermann's rule of thumb guidance that 1% by weight Acid Malt drops mash pH by 0.1 points. That methodology could easily be grafted into this scheme as well, or used stand alone as a decent core for software in this arena.

As an aside, it was mentioned recently that I'm pedantic, and that played a part, and hopefully this exercise will show that I can play in the "ballpark" or "close enough for government work" arena, as well as "dabble" (which is all I honestly do) in the far more technical arena. AJ (who's shoes I am unworthy to tie) often mentioned how simple this stuff actually is at its core, but then he (in my personal opinion) never quite fully divulged the simplicity. I'm just offering open and shared and free exploration into the simplicity here. And also integrating it into a functional whole. If nothing else, the utter simplicity and functionality of it (as can be seen in just how little is required in my integrated approach above) may make a few brewers ponder as to why one would actually consider paying money for stuff that can potentially be just this simple.
 
Last edited:
As to tweaking, the first and easiest tweak entry point might be to slightly alter the 5.92 constant in the formula at step 4. I would suggest lowering the value of this constant in increments of perhaps ~0.05 or less at a time if (for example) mash pH's for light colored beers are being over acidified and are measuring low in actual post-adjustment mash pH as a consequence. Perhaps this constant needs to vary with SRM (I.E., to be replaced by a variable). But I would only begin playing with this constant's value after "instrument measured" proof exists whereby to justify altering it.

The next tweaks to attempt would be to alter the 0.035 and 0.0003 constants within the same formula by very small increments.

Lastly, different constants at step 4 for different ranges of SRM's, and/or for different grist component make-up would potentially be the key(s) to improved overall precision.

Getting the best math model fit to instrument measured and confirmed pre-adjustment mash pH in step 4 is virtually the entire key to mash pH assistant software success. Any transition away from the simplicity of an SRM based system would be done at the juncture of this step.
.
 
Last edited:
Yet more optional refinement tweaks for your consideration and enjoyment:

Ballpark Observation: Doubling the weight of the grist while keeping batch size uniform in and of itself results in a ballpark 60% rise in SRM, as well as a ballpark 90% increase in OG. Therefore:

If we now consider the 3 formulas found within the OP to be valid only for a beer with an OG of 1.050, then the following two modifications are valid tweaking considerations whereby to account for OG's other than 1.050 (wherein both must be implemented together, and therefore you can't choose to implement only one or the other of them):

Step 3.5) Normalized_SRM = Actual_SRM * (-7.5*OG + 8.875)

Step 5.5) Adjusted_mEq_Grist = Step_5_mEq_Grist/(-2*OG + 3.1)
 
Last edited:
More added complexity for your consideration and enjoyment:

For the "ballpark" consideration of acids other than 88% Lactic Acid, divide total mEq's by the following values instead of 11.7:

85% Phosphoric Acid: 14.9
75% Phosphoric Acid: 12.3
30% Phosphoric Acid: 3.67
10% Phosphoric Acid: 1.09
88% Lactic Acid: 11.7
80% Lactic Acid: 10.3
AMS (CRS): 3.66
 
The only problem I see here Larry, is that in the effort to “ballpark” all this stuff and make it more digestible, you’re glossing over units, explanations, etc.

Frankly, most people don’t really care about the nuts and bolts of the chemistry and just want a sheet that gives them outputs. This assistant won’t really serve those people. Anyone who is going to spend the time putting all this into a sheet is going to want more info, which negates the ballpark aspect.

Short story long: you’re aiming this at the wrong crowd either way.
 
Units can be seen in many of my other posts. I'm keeping this one light and not cluttering it with a lot of technical stuff which might have the negative effect of scaring non-technical people off.
 
But as I see it, it will be obsolete (for serious use) out of the box as long as SRM is used to compute the grist's acid contribution. There's a reason J. Palmer winces a little when anyone brings up his old nomographs/sheet, i.e. where you get your color from makes all the difference.

I know nothing with respect to the inner workings of said nomograph, or any spreadsheet derived from it, but 'perhaps' (meaning I'm purely speculating here from a standpoint of ignorance of its workings) it is a false presumption of linearity in color derived grist_mEq's (I.E, acid contribution) that may make for much of the difference in potential precision. Notice that in the "all critical" computation of pH_M in step 4 the relationship which I present is non-linear. That's why I say fully kick the tires across a broad spectrum of SRM's and real world grists, and tweak the "entry level" formula constants seen in step 4 mildly before throwing stones. In the method provided here the pre-adjustment mash pH tends to bottom out at a ballpark of ~4.9 no matter how dark the grists SRM color is. This is a highly non linear delimiter which may or may not emerge from a nomograph (and again I have no clue about what makes such a nomograph tick). And pH ~4.9 corresponds to much posted "measured" observation with respect to real world "lowest ever encountered" reporting of measured mash pH's for intentionally/excessively robust grist recipes as reported by participants on this forum. I don't believe I've ever seen a report of a measured mash pH taken at room temperature which was below 4.8, sans for those for which pH meters are not calibrated and/or functioning properly, or the meter user made the false presumption that ATC makes measurement temperature irrelevant.

Notice that in none of this am I bashing more sophisticated approaches to deriving pH_M, such as used within my own and most other mash pH assistant software. Also notice that the highly respected Brewers Friend's online mash pH assistant program still (to my knowledge) offers a purely SRM color based option. And I can only presume that BF does so because it makes the process that the user must go through much more simple. And because it likely gets you into the adjustment output ballpark. The methodology which I present here shares (to my knowledge) nothing in common (as to its SRM based math modeling of the "all critical" pH_M) with BF sans for the same goal of simplicity and ease of use.
 
Last edited:
I've often pointed out the pros and cons of using grain DIpH or grain color values for mash pH prediction. In my experience, the grain color method is not inferior to the grain DIpH method in any major way. Prediction by DIpH depends on inputting the accurate results of titration testing of each grain type used in the mash. And that level of testing is just not practical for the majority of craft and home brewers. Leaving us with a shortlist of published batch specific grain DIpH values to work with. Prediction by color is widely accepted by craft and home brewers because Maltsters publish the color of their grains making them widely available. Discrepancies in the values of either grain DIpH or grain color then affect the modeling of grist buffer capacity. Which then influences the effect of salt and acid additions in the mash, etc., etc..
 
I've often pointed out the pros and cons of using grain DIpH or grain color values for mash pH prediction. In my experience, the grain color method is not inferior to the grain DIpH method in any major way. Prediction by DIpH depends on inputting the accurate results of titration testing of each grain type used in the mash. And that level of testing is just not practical for the majority of craft and home brewers. Leaving us with a shortlist of published batch specific grain DIpH values to work with. Prediction by color is widely accepted by craft and home brewers because Maltsters publish the color of their grains making them widely available. Discrepancies in the values of either grain DIpH or grain color then affect the modeling of grist buffer capacity. Which then influences the effect of salt and acid additions in the mash, etc., etc..

I wish I could apply more than a single "like" to this response.
 
How big is the ballpark we are playing in when we presume that a mash as measured at room temperature should fall somewhere between 5.2 pH and 5.6 pH? After all, the difference between 5.2 and 5.6 appears so small as to be trivial. One can argue (or toss up excuses) about the impact of buffering, but such does not deny the fact that there must be 2.51 free and thereby pH meter detectable H+ ions in solution (H+ being a single ion of acidity) at 5.2 pH for every single free and thereby pH meter detectable H+ ion present in solution (I.E., the Wort solution) when at pH 5.6.

We are therefore talking about the generally full acceptance of things being just fine and dandy within the mash for a free acidity swing of ballpark 250% when being detected by a well calibrated and properly utilized pH meter here, and not an apparent pH swing or differential of ballpark 8% or 9% (such as the linear ratio difference between 5.2 and 5.6 seems to imply intuitively).

More specifically: (10^-5.2)/(10^5.6) = 2.512 = 251.2% (as opposed to 5.2/5.6, or 5.6/5.2)

If the science of buffering and pHDI can only be expected to get us within 250%, it is not in the end a very good science. The potential likelihood is that color based methods may not be all that different in the end vs. attempts at gaining appreciably higher precision. And then, even if one does achieve higher precision via pHDI and buffering (say, +/- 0.1 pH point), where has it ever been definitively proven that such a gain in precision results in a better tasting or more long term stable beer?

Of late I've been coming around to an opinion that targeting 5.0 to 5.2 pH post boil and cooling and pre fermentation has more relevance to the "potential" for achieving both a good tasting and longer term stable beer. The only remaining major question for me is whether to make this pH adjustment pre-boil, during the boil, or post boil.
 
Last edited:
I have no major issue with using models based strictly on grain color values. I don't happen to use them myself anymore. I do think the ideal model might use pHDI and buffering data where available, and estimated pHDI/buffering, based on grain type and (in some cases) color, where the data isn't yet available. (Also, the list of grains with pHDI and buffering data has grown in the last couple years.)

My "concern" is with models that use "batch SRM."

For example, a 15 SRM beer's grist made from Briess 2-Row and Briess Roasted Barley and a 15 SRM beer's grist made from Briess 2-Row and Briess Caramel 40 are not in the same ballpark* pH-wise. Yet those two grists are the sort of thing the "batch SRM" models would say are equal.

*By ballpark, I mean within about 0.05 or so. Just hitting something between 5.2 and 5.6 (or whatever) is nice, but we can do better.
 
I'd guess them to likely be within ~0.2 pH. That's not "necessarily" out of the "close enough for government work" ballpark (although it admittedly could be). But as @ScrewyBrewer stated, for individual lots of malts, who is to determine (this side of actually and individually testing the malts) which methodology will in the end prove to be definitively more right or wrong when a single batch of beer is being mashed.

That plus research into peer reviewed literature has shown me (as seen within another of my threads) that the chosen mashing method (single infusion, step, or decoction) can in and of itself lead to fully 0.2 pH points of mash pH differential or swing, and no ones software factors this in.

And lastly, I mentioned the potential for a "feathered or layered" approach to SRM, and when I was thinking of this feathering or layering terminology, I was specifically thinking that an optional enhancement to SRM based could easily incorporate a multiplicity of formulas to be chosen for step 4 (whereby the user inputs a degree of roasted factor, such as for the Kaiser Water Calculator or the Brewers Friend SRM calculator, and this factor alters the constants within step 4, or alternately switches internally to a differing formula with which to derive output for step 4). But that is clearly starting to get us away from simple.
 
Last edited:
What mash pH is the result for @VikeMan's two proposed 15 SRM recipes when the following occurs:

1) Person 'A' makes a batch of 15 SRM beer via 40L Caramel malt and 2-Row, and unknown to him his lot of 2-Row has a DI_pH of 5.55.

2) Person 'B' makes a batch of 15 SRM beer via Roasted Barley and 2-Row, and unknown to him his lot of 2-Row has a DI_pH of 5.85.

(or visa versa)

And who arbitrates as to which brewer made the better beer? The more stable beer?
 
Last edited:
Hmmm. It sounds like you are arguing something like the following...

"Why worry about a known source of error when there are other potential (unknown) errors?"

Is that a fair statement?
 
The best calculator is the one that takes the best inputs a brewer has at his/her disposal and uses an algorithm that gets them to within the combined margin of error for all the measurement components.

I think we've all made a hobby out of refinement toward that goal but it's very tough with a large data pool.
 
Hmmm. It sounds like you are arguing something like the following...

"Why worry about a known source of error when there are other potential (unknown) errors?"

Is that a fair statement?

It is, and of course the best answer to this dilemma (as attested by AJ) is to strive to eliminate all potential sources of error. But to do so requires knowledge that can only come from endless testing. And just as critically, assuring that the test methodology scales perfectly to the real world of a batch of beer. Otherwise one can only hope to "potentially" hit the mid-range of all potential known and unknown variables and variabilities with ones methodology for targeted precision, and even this is not possible if one decoction mashes, another step mashes, and another single infusion mashes, let alone sparging and no-sparge..

But then Charlie Bamforth, Anheuser-Busch Endowed Professor of Malting and Brewing Sciences at University of California, Davis once said:
There have been surprisingly few (if any) detailed studies of the precise impact of pH on mashing performance and wort composition. Textbooks of brewing make reference to "optimum" pH for parameters such as extract and wort filtration though they are conspicuous by the lack of references. One textbook refers to a previous textbook! It seems that a largely empirical approach has been employed. How the data has been generated and on what scale (lab mashes are not always good mimics of commercial mashes) is unclear. Furthermore, the manner by which the pH has been adjusted in such studies is seldom apparent, despite its tremendous importance. For example, in my own laboratory we demonstrated that different performance was observed in small-scale mash filtrations depending on whether the pH was adjusted by using mineral acids, lactic acid, or calcium.

What he is implying is that one textbook references another without scrutiny or verification in an endless circular reasoning akin to (totally invalidated) science by consensus (and even worse that this, consensus that starts with potentially only one never scrutinized source). One forum member once said this was akin to a circle jerk. Have we all been circle jerked by mash pH?
 
Last edited:
Also, the list of grains with pHDI and buffering data has grown in the last couple years.

My "concern" is with models that use "batch SRM."
The list of grain DIpH values are limited to the specific batches of grain used in the testing. There is no guarantee by the maltster of DIpH consistency across their batches of grain.

I am not aware of a calculator in particular that would use batch SRM to model pH.
 
I am not aware of a calculator in particular that would use batch SRM to model pH.

It depends upon what is intended by batch SRM. I saw it as a reference to all known SRM based methodologies, which in my limited world means the Kaiser Water Calculator, Brewer's Friend's SRM mode (which appears to be the Kaiser Water Calculator, or closely modeled upon it as if potentially by the same hand), and now this (outlined sketch of a) method I've tossed out here. There may be more that I'm not aware of. I've never put all of my sketch into a single spreadsheet to even give it a full blown trial run. I've tested only bits and pieces of it along the way, literally as I've been both fabricating and presenting them here in this thread, much as if thinking while typing (to lend an indication of how easy this stuff is), but I've never tested the whole of it. I figured that a few interested readers may pick up the ball.
 
Last edited:
It depends upon what is intended by batch SRM. I saw it as a reference to all known SRM based methodologies......
In the sense that any combination of grains that produce wort of the same SRM? Whether the mash consists of 2-Row and Caramel malt or 2-Row and Roasted Barley.

How could doing so even make sense when Roasted Barley and Caramel 40L have such different buffering characteristics.
 
By "batch SRM," I meant models that estimate pH based on the SRM of the finished batch of beer. They did exist in the past, and in the current exercise.
 
By "batch SRM," I meant models that estimate pH based on the SRM of the finished batch of beer. They did exist in the past, and in the current exercise.

Kaiser Water Calculator : Active? (I'm certain some are still using it. I peek at its output occasionally)
Brewer's Friend (SRM Mode) : Active
This thread : Active (once someone constructs it)
 
Last edited:
Kaiser Water Calculator
Brewer's Friend (SRM Mode)
This thread

Kai's calculator (and Brewer's Friend SRM mode I think) at least distinguishes between color coming from "roasted malts" vs all other grains, which I think is a slight improvement over "pure" batch SRM. Of course, you have to "manually" compute the roasted malt color contribution (as a % of total color) and enter it. That said, it's been many years since I've heard someone say they actually use Kai's spreadsheet. Very cool in its day, but now obsolete.
 
Kai's calculator (and Brewer's Friend SRM mode I think) at least distinguishes between color coming from "roasted malts" vs all other grains, which I think is a slight improvement over "pure" batch SRM. Of course, you have to "manually" compute the roasted malt color contribution (as a % of total color) and enter it. That said, it's been many years since I've heard someone say they actually use Kai's spreadsheet. Very cool in its day, but now obsolete.

They use what I have referred to as a feathered or layered approach. And so does a spreadsheet using DI_pH and buffering, with layers of built in information ranging from loose to tight. The Chinese would likely say (as transliterated) to this: "Same, same, but different" (a saying my youngest daughter claims to have heard often when she was living in mainland China as a high school English teacher).

That reminds me of a story. My daughter was not permitted by the Chinese government to speak in Chinese to her students, but she is fluent in reading and writing and speaking Mandarin Chinese. Her students occasionally (as students do) made fun of her in Chinese, presuming that she had no clue as to the content of their snide remarks. Then one day she began (out of frustration) to converse with them fluently in their own language, and per my daughter, some of the students in the class began to cry, and many apologized then and there for their shameful past (and present) rude behavior. They were somewhat more model students thereafter.
 
Last edited:
The best calculator is the one that gives the highest percentage of "close to measured" answers across the spectrum of potential grists and mash methodologies and recipe styles. With all of the unknowns that still haunt this science, who knows, but a purely empirical methodology may even win the prize if tweaked sufficiently enough in the right direction(s). But this thread is about the easiest calculator. I say, build it, test it, then tweak it and if/as necessary feather like layer it whereby to enhance it as you strive for perfection as gauged by careful measurement. I'm not claiming any rights to it, but an acknowledgement within the credits would be well appreciated. Only step 4 is likely to, or potentially likely to uniquely bare the signature of my handiwork, but who knows, perhaps someone out there can even lay claim to having gotten there first. The rest is in the public domain. Oh, and don't forget to make it look nice. I've heard (shamefully and embarrassingly enough) on occasion that "you don't sell the stuff, you sell the fluff", or alternately that "you don't sell the steak, you sell the sizzle". I don't like to hear this, as I strive for accuracy, but plenty have emailed me to inform me that they won't use 'MME' because to them it looks ugly or has an abhorrent color scheme, or both. Apparently, one must have their priorities.

But rest assured that there is absolutely zero correlation between the conception that a program outwardly looks like it is spectacularly amazing and the reality as to whether or not it factually is amazing. And no matter how many fall into the classic "fluff and sizzle" trap, rest assured that softwares accuracy in meeting the intended goal is not measured by taking a head count of users, any more than science is measured as to its validity via a head count of scientists whereby to determine and establish a "scientific consensus". New revelations in science are achieved and advanced via going against the grain of consensus. I like to correlate this to the saying of 19th century philosopher Arthur Schopenhauer:
All (new) truth passes through three stages. First, it is ridiculed. Second, it is violently opposed. Third, it is accepted as being self-evident.
The trick here being that software can only model and thereby attempt to mimic "future" truth on the basis of probability. It can not ever in and of itself generate certain truth. Therefore no mash pH predicting software can ever output aforehand actual "future" truth and thereby be accepted as self evident. But that has never stopped home brewers from proclaiming certain of such software (generally via the fallacy of head count consensus) to have transcended to the actual achievement of this goal of self evidence, such that it is worshiped at a level whereby it is passed from current believer to potential future believer that it is no longer necessary to own or even consider owning a pH meter. Is this not yet another example of a "circle jerk"?
 
Last edited:
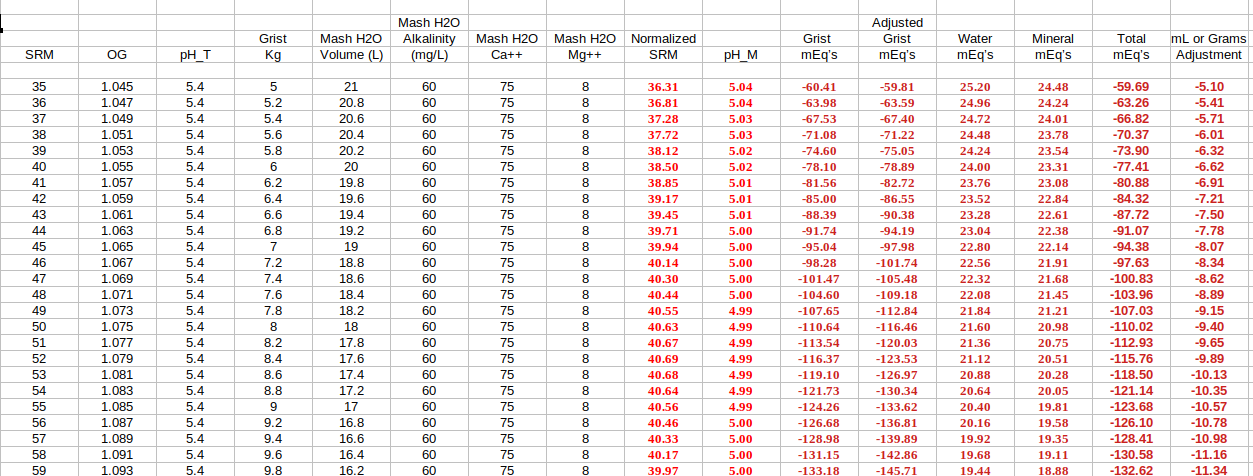
A few minutes ago I quickly and easily generated a very crude spreadsheet incorporating all of the above, and here is a snapshot. I just copied and pasted the formulas as seen here into a spreadsheet and then replaced names with spreadsheet cell locations via point and click. Input is in black, and output is in red. This one shows the impact of SRM color changing.

SRM_Based_Calculator.png

.
 
This snapshot shows a bunch of potential dark beer outputs with several variables being manipulated (somewhat arbitrarily, as I didn't try to check and have them make 100% logical sense). It gives a flavor of what change brings.

SRM_Dark_Beers.png
 
Apply common sense and leave out the color contribution due to the Sinamar.

Yes, obviously I know that's the answer but this calculator is not for me. Can we assume that if someone is told that batch SRM is the main input that they will make that distiction?
 
At the ground floor entry level of this software, and given the clear disclaimers that this is merely an outline or sketch in undeniable need of feathering, layering, and tweaking if anything beyond simplistic entry level is expected of it, few home brewers are concerned with Sinamar. This effort is not thereby much different than Brewer's Friend in SRM mode as to its inability to address the obscure. Throw up roadblocks of obscurity if you must, but realize that it is (to my knowledge) the first "published" (if a forum such as this can be properly associated with this word) effort at reaching those with only a hand held calculator or some rudimentary spreadsheet experience and lending them a groundwork wherewith to accomplish on their own the building (via mere copy and paste no less) of what many for years to perhaps decades have likely imagined requires some level of degree certified understanding.

I conjured up a couple later "potential" tweaks as seen in this thread, and these themselves are indeed in need of scrutiny and evaluation as to their ability to elevate this effort from the absolute ground floor, without sending it into the basement by mistake. Due caution is advised as to applying them.

The next logical step would be to reveal how pH_M can and should be simplistically calculated by means other than, and superior to, SRM. Due to this thread the ball is now in play. And all players are welcome to pick it up and run with it.
 
It should be stated that the two spreadsheet snapshots seen above include the two controversial tweaks.

It should also be said that a single line is all that is required, and I tossed in multiple lines whereby to better and more easily see the difference in output (the last column of the spreadsheet) as incremental change takes place.

And lastly, black is user input, and red is spreadsheet output.
 
Back
Top