Looking for newer Cincinnati water report

Homebrew Talk - Beer, Wine, Mead, & Cider Brewing Discussion Forum

Help Support Homebrew Talk - Beer, Wine, Mead, & Cider Brewing Discussion Forum:

This site may earn a commission from merchant affiliate links, including eBay, Amazon, and others.
Does anyone have newer reports?

So far I can only find 2014 numbers from the Cincinnati Miller plant and 2011 numbers from the Cincinnati Bolton plant.

(I need both because I sometimes brew up north with my friends in West Chester, and they get their water from Bolton. And make no mistake, 9.0pH is no misprint. That's what's coming out of Bolton. I just tested again it last night. It always surprises me.)

9 is normal coming out of Bolton (avg is actually 9.2-9.3)... I get between 8.5 and 8.8 from the Miller plant. Butler County buys water wholesale from GCWW and City of Hamilton, and I believe they use soda ash to add more alkalinity. Years ago I worked on a job and we put some transmission mains up US42 and US22 to feed water towers in Butler and Warren Counties, but they ran down to the Miller plant on the river. You might need to find out which tower your friend's house is fed from in West Chester to determine the water source.
 
Last edited:
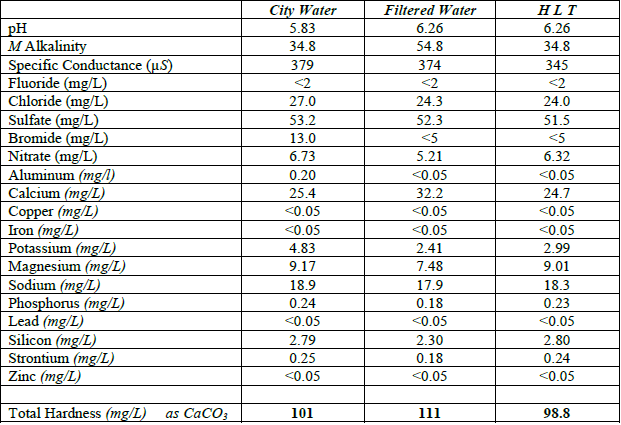
I've been looking at the report but in terms of the water profile calculators I've looked at I'm not seeing how this is useful. It doesn't seem to have most of the parameters that are needed but maybe I'm missing something?

You're not missing anything. I've seen that report many times. Sorry Buckeye Hydro, that report is near useless for brewers here, other than to help you determine which plant you're being serviced by.

However, I just obtained an updated report (10/2017) for Cincinnati (Miller Plant) from a brewer at Rhinegeist. Enjoy and happy brewing!


Cincinnati Water (Miller) - October 2017
pH - 8.19
Calcium (mg/L) - 30.6
Magnesium (mg/L) - 10.8
Sodium (mg/L) - 23.3
Sulfate (mg/L) - 64.8
Chloride (mg/L) - 20.5
Bicarbonate (mg/L) - 81.7


additional details:
M Alkalinity - 81.7 (expressed as bicarbonate, as far as I can tell in my research)
Specific Conductance (µS) - 310
Fluoride (mg/L) - <2
Chloride (mg/L) - 20.5
Aluminum (mg/l) - <0.05
Copper (mg/L) - <0.05
Iron (mg/L) - <0.05
Potassium (mg/L) - 2.31
Phosphorus (mg/L) - 0.17
Lead (mg/L) - <0.05
Silicon (mg/L) - 2.14
Strontium (mg/L) - 0.25
Zinc (mg/L) - <0.05
 
No need to apologize to me... Someone asked for it and I provided. No worries. :)
Actually, you were replying to me. But what I'm trying to explain is, that is not the water report any brewer would be looking for. It's of no help for building water profiles for brewing.

For brewing you need to know the pH, as well as the Calcium, Magnesium, Sodium, Sulfate, Chloride, and Bicarbonate content in ppm (mg/L). These are usually obtained by having an analysis of the water done by a lab -- municipalities rarely have all these numbers available.

I appreciate that you were trying to help, and thanks, but I'm just letting you know the report that the GCWW provides is not what brewers are looking for. :)
 
Old thread... I know. But this info is still pertinent.

Greater Cinn Water works has two treatment plants - Miller and Bolton. Page 19 of this report shows the service area for each: https://www.cincinnati-oh.gov/sites/water/assets/File/WQTBrochure.pdf

There are data available that includes many more analytes than the annual Consumer Confidence Reports:

2020 water quality data for the Miller Plant: https://www.cincinnati-oh.gov/sites...ptFY20_CWQ_Table5_RAW AND FINISHED_MILLER.pdf

2020 water quality data for the Bolton plant: https://www.cincinnati-oh.gov/sites...ptFY20_CWQ_Table6_RAW AND FINISHED_BOLTON.pdf

Russ
 
FYI, I pull from the Miller plant. I sent a sample to Ward Labs and put the results on Brewers Friend.
https://www.brewersfriend.com/homebrew/water-profilesFlorence Kentucky Water - 3/2022
If you get your water tested you can add it to the site. Please add the month and year so others will know how old and what time of the year the sample was taken. Water that is pulled from run off such as the Ohio River changes through out the year, farm crops and weather make slight changes. Not sure if water from the miller plant taken the same date at different locations would mak a difference.
Maybe the water profile should say "Cincinnati, Ohio Miller plant 3/22".
 
Water coming in to Westwood, April 2022.

1651663286295.png
 
My water report from Ward Labs dated 3/15/2022 states my pH is 8.0. I pull from the Miller plant.
Verified with my pH meter at 7.96. Test strips showed greater than 7.5.

I saved a comparison sample pulled the same time I pulled the sample for Ward labs. It shows my pH meter is very close.

Test strips are okay for the pool but I don't swim in my beer and try not to drink the pool water.

How much swing do you see in the pH over a year? I know the Ohio river changes with the seasons due to rain fall and run off from the fields. Has any one plotted this? Does it change enough to matter?
 
Back
Top