An Analytical Comparison of pH Estimation Algorithms

Homebrew Talk - Beer, Wine, Mead, & Cider Brewing Discussion Forum

Help Support Homebrew Talk - Beer, Wine, Mead, & Cider Brewing Discussion Forum:

This site may earn a commission from merchant affiliate links, including eBay, Amazon, and others.

Big Monk

Trappist Please! 🍷
Joined
Dec 24, 2015
Messages
2,192
Reaction score
1,151
In order to clear the air about what spreadsheets do what and how, as well as to see how they react to equivalent input data, I am going to run through 2 distinct scenarios with each program and then discuss how they estimate in their stock form, how their estimations can be brought closer to one another with slight modifications to the equations, and make recommendations based on those observations.

I will only be analyzing Grist pH, i.e. the effect the grain bill will have on pH in the absence of minerals, alkaline source water, and additional acids or bases. (I have expanded to look at some other variables as well, including mineralization, volume, and Sauermalz.) I think the places where most sheets/programs differ is in how they handle malt. The differences in how they handle minerals, alkaline source water, and additional acids or bases could be easily rectified as the fundamentals behind calculating those things is bulletproof.

The participants:

EZ Water 3.0.2
Brun Water 4.2
Mash Made Easy 5.20
Brewer's Friend Water/Recipe Calculator
ezRecipe 1.24
MpH 3.0
Brewing Engine 0.81 (Linear)
Brewing Engine 0.81 (Polynomial)

UPDATE:
I removed Kaiser Water 1.58.
Changed to Brun Water 4.2.

The inputs:

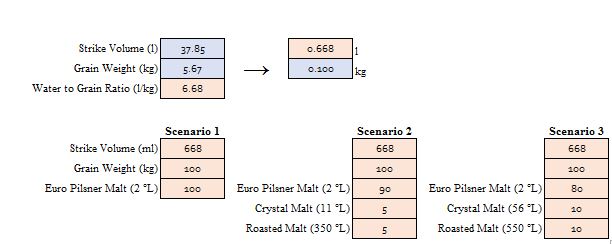
No-sparge Mash - 10 gallons/37.85 liters

Grain Amount - 12.50 pounds/5.67 kg

Grain Bill 1 - 100% Continental Pilsner Malt (2L with 5.80 DI pH)

Grain Bill 2 - 90% Continental Pilsner Malt (2L with 5.80 DI pH)
5% Light Crystal Malt (11L with 5.19 DI pH)
5% Light Roast Malt (350L with 4.69 DI pH)

Grain Bill 3 - 80% Continental Pilsner Malt (2L with 5.80 DI pH)
10% Medium Crystal Malt (56L with 4.83 DI pH)
10% Dark Roast Malt (550L with 4.48 DI pH)

Source Water - Distilled/RO with 1.58 mg/l Alkalinity as CaCO3

The Scenarios:

#1 - All 3 grain bills will be run through each calculator using equal inputs and no coding changes/external calculations. The pH estimation will be noted and put into a table.

#2 - All 3 grain bills will be run through each calculator using equal inputs but with coding changes to equalize DI pH for the grains. If this function is enabled in each spreadsheet it will be used, if not, hand calculations using the software's known equations will be conducted. The pH estimation will be noted and put into a table.

Both tables will be compared to note differences and similarities, as well as to provided a springboard for conversation.

Stay tuned...

Please hold off on posting any of your own results until I get my tables posted in this thread. We can analyze the results and troubleshoot together.
 
Last edited:
awt6.gif
 
BW does not to my knowledge permit either DIpH input or override. How will you input your stated pH's into BW?
 
Ok here are my results for ezRecipe v2.01 which right now is my current focus for testing. v2.01 has fields displaying the predicted color based DIpH values as well as for overriding those values with known DIpH values. It also has a feature for entering and blending multiple water sources such as tap and RO water for example. Many of the new water calculations used in v2.01 are based on the prior work of @dmr in his MpH v3 water calculator.

Following the directions in your initial post, I came up with the following results. Currently, v2.01 allows the selection of 3 different mash pH prediction methods. A DIpH override, a color-based analytical and a color-based empirical method. I have included the results of all 3 pH calculation methods below.

10 gallons mash water with 1.58 ppm as CaCO3 alkalinity
12.50 pounds of grain
4 qt/lb mash thickness

--------------- Grain Bill 1 ------------------
12.50 Lbs. - 100% Continental Pilsner Malt (2L with 5.80 DI pH)
-----------
12.50 Lbs. total grist

Predicted mash pH: 5.80 (using test grain bill DIpH values)
Predicted mash pH: 5.63 (using grain color derived DIpH values)
Predicted mash pH: 5.60 (using empirical based color values)


--------------- Grain Bill 2 ------------------
11.50 Lbs. - 90% Continental Pilsner Malt (2L with 5.80 DI pH)
.625 Lb. - 5% Light Crystal Malt (10L with 5.19 DI pH)
.625 Lb. - 5% Light Roast Malt (350L with 4.69 DI pH)
----------
12.50 Lbs. total grist

Predicted mash pH: 5.72 (using test grain bill DIpH values)
Predicted mash pH: 5.63 (using grain color derived DIpH values)
Predicted mash pH: 5.60 (using empirical based color values)


--------------- Grain Bill 3 ------------------
10 Lbs. - 80% Continental Pilsner Malt (2L with 5.80 DI pH)
1.25 Lb. - 10% Medium Crystal Malt (56L with 4.83 DI pH)
1.25 Lb. - 10% Dark Roast Malt (550L with 4.48 DI pH)
------
12.50 Lbs. total grist

Predicted mash pH: 5.58 (using test grain bill DIpH values)
Predicted mash pH: 5.48 (using grain color derived DIpH values)
Predicted mash pH: 5.43 (using empirical based color values)

@RPIScotty I've updated the grist weight and grain percentages to 12.5 Lbs and have updated my results.
 
Last edited:
Ok here are my results for ezRecipe v2.01 which right now is my current focus for testing. v2.01 has fields displaying the predicted color based DIpH values as well as for overriding those values with known DIpH values. It also has a feature for entering and blending multiple water sources such as tap and RO water as an example.

Following the directions in your initial post, I came up with the following results.

--------------- Grain Bill 1 ------------------
20 Lbs. - 80% Continental Pilsner Malt (2L with 5.80 DI pH)
------
20 Lbs. total grist

Predicted mash pH: 5.80 (using test grain bill DIpH values)
Predicted mash pH: 5.72 (using grain color derived DIpH values)
Predicted mash pH: 5.69 (using empirical based color values)


--------------- Grain Bill 2 ------------------
18 Lbs. - 80% Continental Pilsner Malt (2L with 5.80 DI pH)
1 Lb. - 10% Medium Crystal Malt (56L with 5.19 DI pH)
1 Lb. - 10% Dark Roast Malt (550L with 4.69 DI pH)
------
20 Lbs. total grist

Predicted mash pH: 5.72 (using test grain bill DIpH values)
Predicted mash pH: 5.63 (using grain color derived DIpH values)
Predicted mash pH: 5.51 (using empirical based color values)


--------------- Grain Bill 3 ------------------
18 Lbs. - 80% Continental Pilsner Malt (2L with 5.80 DI pH)
1 Lb. - 10% Medium Crystal Malt (56L with 4.83 DI pH)
1 Lb. - 10% Dark Roast Malt (550L with 4.48 DI pH)
------
20 Lbs. total grist

Predicted mash pH: 5.69 (using test grain bill DIpH values)
Predicted mash pH: 5.59 (using grain color derived DIpH values)
Predicted mash pH: 5.46 (using empirical based color values)

I should have probably stipulated that we hold the grist amount constant as well.
 
Ok here are my results for ezRecipe v2.01 which right now is my current focus for testing. v2.01 has fields displaying the predicted color based DIpH values as well as for overriding those values with known DIpH values. It also has a feature for entering and blending multiple water sources such as tap and RO water as an example. Many of the new water calculations used in v2.01 are based on the prior work of @dmr in his MpH v3 water calculator.

Following the directions in your initial post, I came up with the following results.

--------------- Grain Bill 1 ------------------
20 Lbs. - 80% Continental Pilsner Malt (2L with 5.80 DI pH)
------
20 Lbs. total grist

Predicted mash pH: 5.80 (using test grain bill DIpH values)
Predicted mash pH: 5.72 (using grain color derived DIpH values)
Predicted mash pH: 5.69 (using empirical based color values)


--------------- Grain Bill 2 ------------------
18 Lbs. - 80% Continental Pilsner Malt (2L with 5.80 DI pH)
1 Lb. - 10% Medium Crystal Malt (56L with 5.19 DI pH)
1 Lb. - 10% Dark Roast Malt (550L with 4.69 DI pH)
------
20 Lbs. total grist

Predicted mash pH: 5.72 (using test grain bill DIpH values)
Predicted mash pH: 5.63 (using grain color derived DIpH values)
Predicted mash pH: 5.51 (using empirical based color values)


--------------- Grain Bill 3 ------------------
18 Lbs. - 80% Continental Pilsner Malt (2L with 5.80 DI pH)
1 Lb. - 10% Medium Crystal Malt (56L with 4.83 DI pH)
1 Lb. - 10% Dark Roast Malt (550L with 4.48 DI pH)
------
20 Lbs. total grist

Predicted mash pH: 5.69 (using test grain bill DIpH values)
Predicted mash pH: 5.59 (using grain color derived DIpH values)
Predicted mash pH: 5.46 (using empirical based color values)
FYI - Your grain amounts and percentages don't match up.
 
Why don't people hold off on posting results until I get my tables together.

See the red comment above in the OP.
 
Why don't people hold off on posting results until I get my tables together.

See the red comment above in the OP.
I didn't mean to rush you along. I've updated my earlier results using 12.50 pounds of grist and corrected my grain percentages across all 3 test scenarios. I wanted to get my results posted in case I need to run out for some errands today.
 
Last edited:
Okey Dokey. Here goes nothing...

First let me show the tables and express some thoughts on the results:

Capture.JPG


Grain Bill 1 (12.5 lbs/5.67 kg 100% Continental Pilsner)

First thing that should strike everyone is the relative parity across the board for Pilsner grist in both scenarios, with just the exception of my own Brewing Engine sheet in Scenario 1. My malt class and it's assigned DI pH value for Euro Pilsner is 5.85, so that explains the difference. Also look at Scenario 1 and see that all the color based sheets show relative parity with one another but are a bit lower than mine. The exception in the color based sheets is Mash Made Easy, which has modifiers for Base malt DI pH. I selected the 5.77 to 5.82 modifier for Scenario 1, but switching to 5.72 to 5.77 actually lines it up quite nicely with the other color based sheets at 5.75.

There is pretty darn good parity across all sheets in Scenario 2 for the Pilsner grist. This has implications down the road, as it seems to indicate that it's where Crystal/Cara and Roasted malts are handled is what distinguishes us from one another.

Grain Bill 2 (12.5 lbs/5.67 kg 90% Continental Pilsner, 5% 11L 5.19 pH Caramalt, 5% 350L 4.69 pH Roasted)

In Scenario 1 we start to see the values diverging ever so slightly from one another. We know EZ Water only uses color for Caramalt but it seems to track with my sheets pretty closely. The differences, obviously are probably down to the DI pH values assigned to roasted malts and base malts. BW, ezRecipe, BF, and MpH are tracking pretty close to one another. Mash Made Easy goes a little low here, but i have the feeling it involves how Larry is using his Log Base 10 system as opposed to a more straight up weighted contribution for each malt's DI pH. If I run Scenario 1 for Grain Bill 2 using Mash Made Easy, but calculate the Pre Acid/Base Mash pH using a weighted calculation for their contribution, I get 5.72 using the 5.77 to 5.82 modifier dropdown, and 5.67 using the 5.72 to 5.77 modifier dropdown. More discussion on this may be warranted in order to determine if the Log Base 10 approach works here.

For Scenario 2, we see that BW, MME, MpH, and my Polynomial Brewing Engine are pretty darn close to one another. That likely says a few things about all of them, in particular how we are treating cara and roasted malts. Although I should note that MME bypasses color based acidity when you bypass the DI pH calculation. The differences in my Linear and Polynomial Brewing Engine are probably chalked up to something A.J. has discussed previously, namely that cara and roasted malts benefit from the full 3 term titration info. You'll notice that EZ water, BF, and ezRecipe are all tracking pretty nicely together. I have a feeling this is down to them wholly bypassing any color or titration based acidity calcs.

Grain Bill 3 (12.5 lbs/5.67 kg 80% Continental Pilsner, 10% 56L 4.83 pH Caramalt, 10% 550L 4.48 pH Roasted)

Here is where we start to see some deviations, most of which I think are going to come down to how all of the sheets and programs are modelling cara and roasted malts.

For Scenario 1, we see that the color based sheets and my Brewing Engine sheets are pretty darn close. The exception is Mash Made Easy, but I have a feeling that is down, again, to how Larry is distributing the pH values in his Log Base 10 method. One thing to note, his sheet is consistent from Scenario 1 to Scenario 2. The outlier in the opposite direction is EZ Water.

For Scenario 2, we see BW and MME come pretty close to one another. I imagine they must be modelling roasted malts in particular pretty similarly. MpH splits the difference between EZ Water, BF and ezRecipe on one end and BW and MME on the other. Brewing Engine stays consistent (if not totally accurate, this is theoretical y'all!) and only really drops between Scenario 1 and Scenario 2 because I change the Euro Pilsner DI pH from 5.85 to 5.80.


General Notes on Execution

EZ Water - Scenario 1 done stock. For Scenario 2, I changed the Stock Pilsner DI pH setting to 5.80 for Grain Bill 1, 2, and 3. I changed the Crystal Malt DI pH in the calculations from 5.22 to 5.19 for Grain Bill 2 and from 5.22 to 4.83 for Grain Bill 3. I changed the Roasted Malt DI pH from the Stock setting to 4.89 for Grain Bill 2 and from the Stock setting to 4.48 for Grain Bill 3.

Brun Water - Scenario 1 done stock. For Scenario 2, I did a hand calculation for mash pH and substituted a weighted sum of the individual DI pHs for the grains for the "idealized" pH value in the equation.

Mash Made Easy - Scenario 1 done stock. For Scenario 2, I subbed in the DI pHs above. It's important to note that when you bypass the calculated DI pHs in MME, it bypasses any color based acidity proxy. I used the 5.77 to 5.82 base malt modifier except for analysis as noted above.

Brewer's Friend - Scenario 1 done stock. For Scenario 2, I subbed in the DI pHs above. It's important to note that when doing this in BF, it totally bypasses the color based acidity proxy.

ezRecipe - Scenario 1 done stock on version 1.24. For Scenario 2, I used the values Vince posted in this thread. It's important to note that in the upcoming version, it totally bypasses the color based acidity proxy when inputting DI pH. Please keep me honest on that Vince.

Brewing Engine 0.81 (Linear) - This is my own sheet based on the charge conservation/Gen II methods put out there by A.J. It uses a table of empirically derived titration data gathered from Riffe's recent paper, Kai's data, A.J.'s data, and a few other published batches of linear, 2 term, and 3 term titration co-efficients, as well as the corresponding DI pH values. I also keep a master file of 2015-2018 Weyermann malt analysis sheet data, including DI pH for base malts. I came up with he malt classes in the sheet using this data. The linear version is based around DI pH and a1 and uses:

q (mEq) = a1 * (pHz - pH DI)

Brewing Engine 0.81 (Polynomial) - Same as above except the polynomial version is based around DI pH, a1, a2, and a3 and uses:

q (mEq) = a1 * (pHz - pH DI) + a2 * (pHz - pH DI) ^ 2 + a3 * (pHz - pH DI) ^ 3


Not sure if any of this helps or hinders the conversation, but that's that!
 
Nice, but since nobody has actually brewed these you don't have actual pH data to reference. IOW, it would be nice to have actual pH measurements of actual mashes at say 15, 30, 45, and 60 minutes to reference with your tables. My guess would be +/- 0.2 pH at a minimum no matter what algorithm is used.
 
Last edited:
Nice, but since nobody has actually brewed these you don't have actual pH data to reference.

It's an analytical exercise aimed at trying to understand the differences in how they estimate.

If you know how something estimates, you can troubleshoot why in some cases it may not match the pH measurement in the brewery.

If a sheet predicts better than others, it's useful to know why. I agree that measurement is King.
 
Last edited:
It's an analytical exercise aimed at trying to understand the differences in how they estimate.

If you know how something estimates, you can troubleshoot why in some cases it may not match the pH measurement in the brewery.

If a sheet predicts better than others, it's useful to know why. I agree that measurement is King.

I understand what you're trying to accomplish but since none of them are measured against reality it's just a guessing game.
 
I understand what you're trying to accomplish but since none of them are measured against reality it's just a guessing game.

A better term would be a theoretical exercise. An analytical exercise would, as you have pointed out, compare brewday data to a number of estimates.

The experimental exercise would be mini-mashes as follows:

Capture.JPG
 
If a sheet predicts better than others, it's useful to know why.

But how do you define better? As in "in agreement with most other spreadsheets"? That might just mean they are all equally skewed or simply just use the same formulas out of the same textbooks. Without actual measurements you'll never know.
 
Without actual measurements you'll never know.

Holy cow you people drive me nuts.

YES! You need to compare estimates to real world data. I'm not arguing against that. I literally just typed this up. I haven't had time to perform 3 mini mashes in the 45 minutes this post has been up.

But how do you define better?

Better would mean closer to actual than the others.
 
If you intend to do the mashes, ensure that at least one, preferably two, other people also do the same with their own calibrated equipment...
 
If you intend to do the mashes, ensure that at least one, preferably two, other people also do the same with their own calibrated equipment...

I think that goes without saying.
 
Even without “actual mashes” this is a worthwhile exercise. The fact that all sheets come up with different values means someone is right and the rest are not. At least for the grists sampled here. So are the differences bad math? Good math but bad models? Are more comparisons needed over a much wider set of malts?
All the sheets advertise accurate estimations, but that can’t be true given the data.
I look forward to learning more!

No, it doesn't mean "someone is right". You can't determine that unless you do actual mashes.
 
No, it doesn't mean "someone is right". You can't determine that unless you do actual mashes.

This is meant as a discussion of how the different pH estimation tools handle grist modelling. We can all agree that in order to show anything significant you need actual measurements.

That should not stop people from being curious about how the different programs model malt, as that is the main disparity between them all.
 
I’m away from my computer now but there are a number of issues with reporting my results. I used ezRecipe v2.01 for starters not v1.24. I think I see a few other issues too but I’ll need to get back before I can point them out.
 
I’m away from my computer now but there are a number of issues with reporting my results. I used ezRecipe v2.01 for starters not v1.24. I think I see a few other issues too but I’ll need to get back before I can point them out.

I used Version 1.24 for Scenario 1 and your results for Scenario 2. You posted another scenario that was outside the bounds of the discussion so I did not include it.
 
Compared to what? Each other? That doesn't do much good unless you can compare against reality.

Why would you not compare how they model the malt system against each other? Is there not interesting information in that comparison?

Knowing how each sheet models the malt system is a useful tool WHEN comparing to reality.

I think we are talking past one another. More importantly, you past me.
 
Why would you not compare how they model the malt system against each other? Is there not interesting information in that comparison?

X: Hey look all the models give an answer of 5.8 pH @ 60 min!
Y: That's awesome but reality is... 5.4 pH @ 60 min!
X: You mean they're all wrong?!?!
Y: Afraid so.
X: Darn guess we should've used an OOP language.
 
X: Hey look all the models give an answer of 5.8 pH @ 60 min!
Y: That's awesome but reality is... 5.4 pH @ 60 min!
X: You mean they're all wrong?!?!
Y: Afraid so.
X: Darn guess we should've used an OOP language.
This is true only if none of them estimate correctly.

This is typically not the case. So if we find one is better at estimating, through the use of a meter, it’s important to note why.

Understanding how they estimate is thus useful.

I’m certainly not arguing against measuring mash pH if that’s what you think.

Not sure what an OOP language is or how it’s relevant.
 
This is true only if none of them estimate correctly.

This is typically not the case. So if we find one is better at estimating, through the use of a meter, it’s important to note why.

Understanding how they estimate is thus useful.

I’m certainly not arguing against measuring mash pH if that’s what you think.

The real measurement is to find out which one(s), if any, can be compared to.

Not sure what an OOP language is or how it’s relevant.

It was a joke based on another thread.
 
It would now be interesting to see the output of these spreadsheets for these simple changes:

Change #1: Mash in 5 gallons of water rather than 10, with all else kept as above
Change #2: Add mineralization to achieve 70 ppm Ca++ and balanced cations/anions for the case of 10 gallons of mash water
Change #3: Add mineralization to achieve 70 ppm Ca++ and balanced cations/anions for the case of 5 gallons of mash water

I said at the outset that I’m not interested in that. This was addressing the grist modeling of each, which is the most disparate between all of them.

We know how to model everything else uniformly and accurately.

I can certainly run them and report them to you. I just don’t want to clog this thread up.

I do think that the greatest hurdles in pH estimation are malt modeling and source water variance.
 
Last edited:

Latest posts

Back
Top