VikeMan
It ain't all burritos and strippers, my friend.
- Joined
- Aug 24, 2010
- Messages
- 5,853
- Reaction score
- 5,970
Mods: Please move this if it doesn't fit in Brew Science.
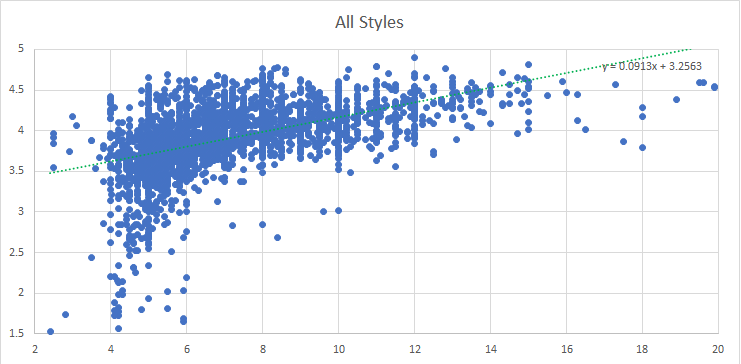
Back in January 2020, I analyzed a bunch of beer rating data painstakingly copied and pasted from Beer Advocate, hoping to confirm or disprove something I thought I "knew" already, i.e. that there is a bias in beer ratings associated with (or at least correlating with) ABV. I meant to share it back then, but must have been distracted by something, because I didn't. I looked at the data several ways (by style, by hoppy styles only, by non-hoppy styles only, etc.), but I saw the same phenomenon no matter how I sliced it. Here is a scatter plot of every beer with at least 500 ratings (2,652 beers). X axis is ABV. Y axis is the rating from BA.

Now, does this mean that beers with higher ABV are better than beers with lower ABV? Is it the impact of more malt flavor? Or body? Does it mean we're alcoholics? Does it mean that people don't really rate "to style" despite their best intentions? If a perfect Imperial Stout is a "5," shouldn't a perfect pub style Blonde Ale also be a "5?" Please feel free to discuss and debate. It's the main reason for this post.
When I visit a big beer destination, I (like most people I would think) try to prioritize the best breweries. Beer ratings are a reasonable starting point, I think. But the ABV bias thing bothers me. I'd rather drink an excellent pilsner than a pretty good DIPA. So for the past few trips, I have used the analysis from back in 2020 to adjust raw beer ratings. Note the line of best fit in the chart. The slope is y=0.0913x+3.2563. So, on average, each increase in 1% ABV gives an increase in score of 0.0913. And the median ABV from the data was 6.8%. So, leaving the raw scores for 6.8% beers as-is, subtracting 0.0913 per each 1% ABV above 6.8, and adding 0.0913 per each 1% ABV below 6.8% is accomplished as follows:
AdjustedScore = RawScore + ((6.8- ABV) x 0.0913)
In my mind, applying that formula for each beer "levels the playing field." (Imagine driving a "Z" axis right through the center of mass of the scatter plot, and rotating until the line of best fit is parallel to the X axis.)
So what happens when applying the formula to the beers on tap at any given brewery? Well, not much, but when comparing adjusted averages for a set of breweries (in a beer destination), it has sometimes had the effect of moving a brewery up or down a spot or two in the pecking order. Which makes me feel better about my final beer destination itinerary, if nothing else.
I also did a sort of similar analysis of NHC winning beers, looking at ABV tendencies vis-a-vis style guideline ranges, and found that beers with ABVs in the upper part of the style guideline range (or often above) tended to win more often. This won't come as any surprise to most experienced competitors, I suspect. But that's a story for another day.
Back in January 2020, I analyzed a bunch of beer rating data painstakingly copied and pasted from Beer Advocate, hoping to confirm or disprove something I thought I "knew" already, i.e. that there is a bias in beer ratings associated with (or at least correlating with) ABV. I meant to share it back then, but must have been distracted by something, because I didn't. I looked at the data several ways (by style, by hoppy styles only, by non-hoppy styles only, etc.), but I saw the same phenomenon no matter how I sliced it. Here is a scatter plot of every beer with at least 500 ratings (2,652 beers). X axis is ABV. Y axis is the rating from BA.

Now, does this mean that beers with higher ABV are better than beers with lower ABV? Is it the impact of more malt flavor? Or body? Does it mean we're alcoholics? Does it mean that people don't really rate "to style" despite their best intentions? If a perfect Imperial Stout is a "5," shouldn't a perfect pub style Blonde Ale also be a "5?" Please feel free to discuss and debate. It's the main reason for this post.
When I visit a big beer destination, I (like most people I would think) try to prioritize the best breweries. Beer ratings are a reasonable starting point, I think. But the ABV bias thing bothers me. I'd rather drink an excellent pilsner than a pretty good DIPA. So for the past few trips, I have used the analysis from back in 2020 to adjust raw beer ratings. Note the line of best fit in the chart. The slope is y=0.0913x+3.2563. So, on average, each increase in 1% ABV gives an increase in score of 0.0913. And the median ABV from the data was 6.8%. So, leaving the raw scores for 6.8% beers as-is, subtracting 0.0913 per each 1% ABV above 6.8, and adding 0.0913 per each 1% ABV below 6.8% is accomplished as follows:
AdjustedScore = RawScore + ((6.8- ABV) x 0.0913)
In my mind, applying that formula for each beer "levels the playing field." (Imagine driving a "Z" axis right through the center of mass of the scatter plot, and rotating until the line of best fit is parallel to the X axis.)
So what happens when applying the formula to the beers on tap at any given brewery? Well, not much, but when comparing adjusted averages for a set of breweries (in a beer destination), it has sometimes had the effect of moving a brewery up or down a spot or two in the pecking order. Which makes me feel better about my final beer destination itinerary, if nothing else.
I also did a sort of similar analysis of NHC winning beers, looking at ABV tendencies vis-a-vis style guideline ranges, and found that beers with ABVs in the upper part of the style guideline range (or often above) tended to win more often. This won't come as any surprise to most experienced competitors, I suspect. But that's a story for another day.
Last edited:


