Small Test Mashes for pH?

Homebrew Talk - Beer, Wine, Mead, & Cider Brewing Discussion Forum

Help Support Homebrew Talk - Beer, Wine, Mead, & Cider Brewing Discussion Forum:

This site may earn a commission from merchant affiliate links, including eBay, Amazon, and others.

DSmith

Well-Known Member
Joined
Sep 5, 2011
Messages
798
Reaction score
78
Location
Robbinsdale
Is 100g of total grains (in about 300mL distilled water for about 1.5 qt/lb ratio) enough to create a small mash to measure pH prior to brewing a new recipe? Does grinding the gain very fine produce results that correlate well to a larger mash with a normal grind? I chose 100g because it's easy to convert any recipe to this by the % of the grains to the total gain.

The purpose would be to determine how much acid would be needed in the big mash (introduced as a wt% acidulated malt), and CaCl2 and CaSO4 would not be used in enough quantities to greatly influence the mash pH. Actual brewing water is 90% RO.

This seems like a managable test to do while heating water and using the same calibrated pH meter for the brewing process.
 
I was thinking about this the other day. A little more work, like a dilution ratio, and you might have a yeast starter out of too. Mash enough that if you dilute it you have a 1.040 wort equal to to whatever starter size you will need.
 
What I was suggesting would not have calcium in the mash, would not be held longer at mash temp than 10 min, and have no way of separating the wort from grain.
 
Well I ordered the Hanna pHep 5 meter/solutions. Is there anything about what's proposed in the original thread that is off-base?

I'm going to try the 100g test mash this month for a new recipe I haven't made before and the last one I did make. Both are actually simple recipies with about 95% base grain (Crisp Maris Otter, Weyermann Pilsner). It'll be interesting to compare the test mash pH to the actual mash pH to the water spreadsheets.
 
The only criticism I would have is that essentially you are going to get the DI pH of the base malt and what's in the spreadsheets or calculators is usually pretty close though there can be variation. Weyerman Pils is about 5.75 and Maris Otter perhaps 5.65. I think you will learn more if mash with the water you are actually going to brew with and add the acid you are planning to add based on the calculator or spreadsheet. The test mash then becomes a check on the spreadsheet/calculator prediction. If the pH is too high, increase the sauermalz (or lactic acid or whatever you are using) and try again.

Things should scale but it's always best to check in the full mash as well as in the test mash.
 
Thanks, that's what I'll do.

I have only been using acidulated malt and if the pH is outside of the range I'm planning on using the 0.1 pH drop per 1% of grain bill acidulated acid rule of thumb instead of redoing the test mash. The final reading will be the real mash the same day with any acid adjustments learned from the test mash.
 
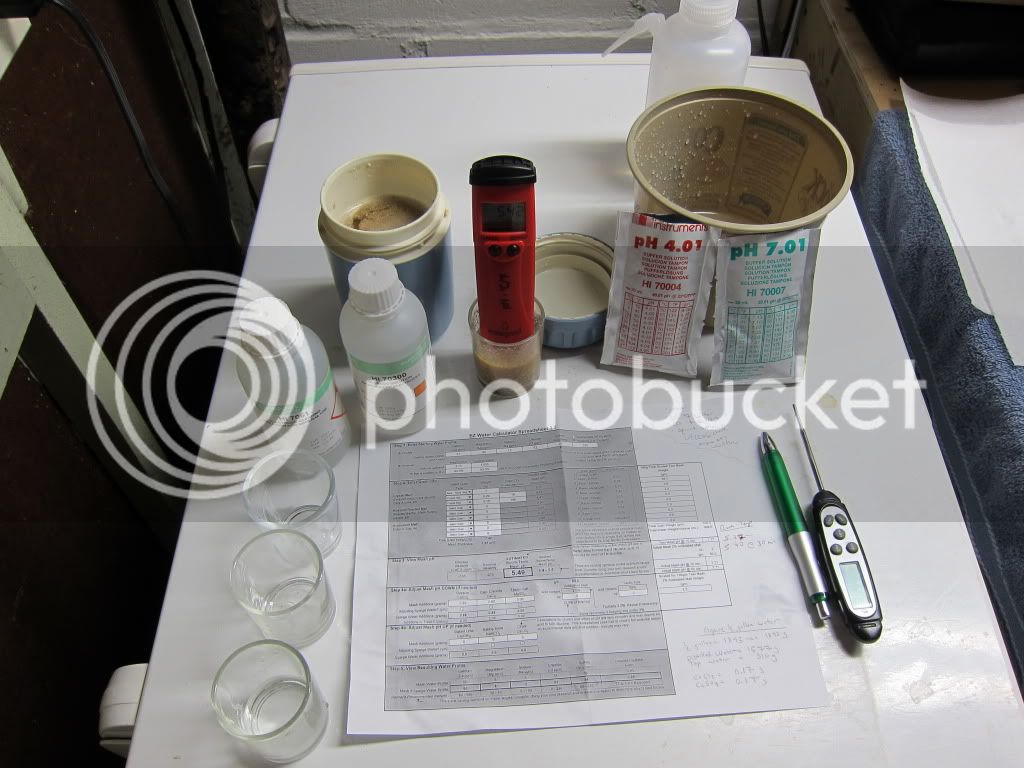
I received my pH meter and re-made a mash with identical grain & water to an ESB that's in primary now. I used the EZ Water calculator to determine the dilution, salt & acidulated malt originally, so the point of my test is a validation of the expected pH and a chance to try out a new toy. The calculations are in a pic below.

The test mash results at 15 minutes is a pH between 5.32-5.42 (accounting for the +/- 0.05 pH documented accuracy of my meter). The test mash results at 30 minutes is a pH between 5.35-5.45. The rise in pH is consistent with using acidulated malt. The expected mash pH is 5.49.

The next step is to perform a test mash on a brewing day while heating up my mash tun & water. This will determine if I need to adjust the actual amount of acidulated malt in the mash, followed by measurements of the actual mash. My first attempt at this will be with a Helles Bock next week.

WaterCalculations.jpg


pHTestMash.jpg
 
The test mash results at 15 minutes is a pH between 5.32-5.42 (accounting for the +/- 0.05 pH documented accuracy of my meter).

You are wise in being aware that the meter is less than perfect but accuracy of ±0.05 does not mean that a reading of 5.37 is equally likely to be anything in the range 5.32 < pH < 5.42. It is more likely to be closer to 5.37 than either 5.32 or 5.42. At the same time it could be higher than 5.42 or less than 5.32 but this is even more unlikely. Beyond that, the accuracy you actually achieve could be better than ±0.05 pH. If the meter is decent the thing which determines the accuracy of a measurement is the buffers. They are typically rated ±0.02 and, as you are taking measurements about half way between the two you should theoretically be able to attain that level. Depending on what they mean when they say "accuracy ±0.05". Given the state of modern electronics it would be hard to screw them up to the point where accuracy would be as poor as ±0.05 so I assume that the problem is drift. You can easily check on this. See Step 11b in the new sticky.

What I suggest is that you just record the pH and the temperature at which you measured it. Then when looking back at your notes from a previous batch you can apply a little 'English' for temperature (0.005 pH per °C) to your pH readings if they are different and were taken at different temperatures.

Also I see from the photo that you have buffers in packets. A new packet should be opened each time you use the meter if more than a day has passed.
 
I took my stabile readings and factored in the +/- 0.05 pH based on the spec sheet that came with the meter. Averaging what I reported in my thread gives the stable readings (5.37 pH @ 15 min, 5.40 pH @ 30 min). I want to make my decidions based off the average reading and equipment inaccuracies. +/-0.02 would be nice.

I checked for drift in the pH 4 buffer and noticed about +0.02 pH after about an hour since the calibration. That drift was not factored into my numbers.

I plan on doing fresh pH calibration packets for each time I use the meter to start out. I'll eventually shop around for more cost effective methods but care more about proving the tool is useful in the way I want.
 
An update on the success of the test mash method described in this thread:

I brewed again and did a 100g test mash using the same % grain, scaled acidulated malt weight, mash ratio & water as the planned brew. The test mash was finished well before the mash water was heated and provided data to correct the acidulated malt in the recipe. Water for the test mash was heated in the microwave and the malt was doughed-in to approximately the same temperature as the planned mash.

pH meter: Hanna pHep5 (98128), fresh 4.01 & 7.01 calibration pouches, meter recalibrated immediately before each measurement.

Planned mash pH using EZ_water_calculator_3.0.1.xls = 5.42

100g test mash pH = 5.59 @ 20 min

Corrected acidulated malt for the actual mash before mashing-in with the rule-of-thumb: Adding 1% of the total grain weight of 2% acidulated malt decreases the mash pH by 0.1.

Actual mash pH = 5.36 @ 20 min
Actual mash pH = 5.38 @ 60 min

This beer was made with 100% RO water and CaSO4 & CaCl2 additions. The RO water came from a local grocery store machine that was last serviced in mid-Feb by the service record on the machine. The higher than expected test pH MIGHT indicate it wasn't as low in alkalinity as expected...

The beer was made of 85% Rahr 2-Row. I assumed a pH of 5.56 in distilled water for planning. The higher than expected test pH MIGHT indicate that 5.56 wasn't the correct pH for the batch of malt I used.

It's not too important to understand why the expected pH was different from the test mash pH by 0.17 but to be able to account for that prior to brewing something new and reserve weighing out the acidulated malt until the last minute.
 
You shouldn't be surprised that the actual mash pH differed from the prediction by that much. It happens all the time. Most of the spreadsheets seem to estimate mash pH from a particular value of DI water pH for the particular malt and an assumption about the malt's buffering capacity. While it is possible, theoretically, to predict mash pH this way getting good numbers to plug in for DI mash pH and buffering capacity is tough.
 
The difference is not surprising with all the variables involved. I'm glad any spreadsheet gets close enough where a simple test mash gets the rest of the way and provides enough information to make adjustments prior to mashing.

The spreadsheet is also useful in the context planning salt additions.
 
Back
Top