Native ESP8266 BrewPi Firmware - WiFi BrewPi, no Arduino needed!

Homebrew Talk - Beer, Wine, Mead, & Cider Brewing Discussion Forum

Help Support Homebrew Talk - Beer, Wine, Mead, & Cider Brewing Discussion Forum:

This site may earn a commission from merchant affiliate links, including eBay, Amazon, and others.
Not sure whether this is off topic, bit I think I have had a bit of a failed update (initialised from the Django interface) due to network issues. So now i get a 504 gateway timeout error when trying to access via my browser. At least I think it's that.

So I can ssh into the pi still and can see fermentrack python, circus processes running in top.

I looked at the fermentrack-stderr.log file and have got an error of (tail):

Debugged import:

- 'fermentrack_django' found in '/home/fermentrack/fermentrack/fermentrack_django/__init__.py'.
- 'fermentrack_django.wsgi' not found.

I also checked the upgrade.log (tail)

ile "<frozen importlib._bootstrap_external>", line 728, in exec_module
File "<frozen importlib._bootstrap>", line 219, in _call_with_frames_removed
File "/home/fermentrack/fermentrack/fermentrack_django/settings.py", line 11, in <module>
import environ
ModuleNotFoundError: No module named 'environ'
ok
ok

So I think something has gone wrong somewhere but can't poke my finger at exactly what. Ideally I don't want to do a clean reinstall. So wondering whether there was a command line fix/upgrade option?

More details can be provided.

Cheers,

Martin

Yep, there is.

Log into your pi, and run the following:

sudo su fermentrack
cd ~/fermentrack
source ~/venv/bin/activate
utils/upgrade3.sh -f -b "dev"


That forces a re-upgrade on the dev branch.
 
Hi @Thorrak !

Firstly, thank you so much for all your work. I'm happily using Fermentrack for one year and a half without any problems...until now.

Last brew was one month ago; after the fermentation, I switched off my raspberry (without touching it at all since that day) and yesterday when I try to access Fermentrack via browser I get:
This site can’t be reached
http://192.168.0.28/
is unreachable.


ERR_ADDRESS_UNREACHABLE


I can access without problem the Raspberry via SSH, but I don't know what I could do to try to fix the problem. If necessary, I can also re-install Fermentrack...but I don't know how to do it.

Thank you so much in advance!

Hey there! I assume you are using the non-docker version of Fermentrack?

If so, then log into your Pi and run this command:

Code:
curl -L "https://raw.githubusercontent.com/thorrak/fermentrack-tools/master/non_docker_install/fix-environment.sh" | sudo bash
 
Hi again @Thorrak and thanks for your answer!

I tried the command and besides the following everything seemed OK:


Collecting psutil (from circus)


Cache entry deserialization failed, entry ignored


Cache entry deserialization failed, entry ignored


Cache entry deserialization failed, entry ignored

But when I try to access Fermentrack I get again the same error of "This site can't be reached".

Honestly, I don't know if I'm using docker or non-docker version :/ If it helps, even if I use Fermentrack for 1 year and a half, I made a new installation on a new SD card about 6 months ago.

Unfortunately, I don't recognize those error messages (though from searching on Google, it sounds like the "Cache entry deserialization failed" message could point to some kind of filesystem issues. When you shut down your pi, did you just pull the plug from the back, or did you log in and shut it down using the shutdown command?

Regardless of the above - now that you've run the command, try restarting your pi. To restart it properly, log in, and run the following:

Code:
sudo shutdown -r now

...then wait ~1 minute and try accessing it again. If you continue to have issues, we can start poking through log files and see if we can tell what is going on.
 
Separately - for future reference - you're almost certainly running the non-docker version. The docker version wasn't available (even for testing) ~6 months ago. ;)
 
Thanks again! I tried to reboot, wait and try to access...but nothing. If it helps, before the "error" it tries to load at least for 15 seconds. How should I do to get the log files to try to figure out what happens? (sorry, probably too noob question!)

Thanks again!
 
Thanks again! I tried to reboot, wait and try to access...but nothing. If it helps, before the "error" it tries to load at least for 15 seconds. How should I do to get the log files to try to figure out what happens? (sorry, probably too noob question!)

Thanks again!

I'll shoot you a PM, as the data I'm going to request you send across is going to get quite long. ;)
 
Hi guys,

I'm new to this ESP8266 BrewPi/Fremwntrack and would like to try it out.


Thanks
 
Last edited:
I have seen alot about Fermentrack on this page and would like to know if BrewPi still supported or should I rather use Frementrack?
In all fairness to @Thorrak, this is his thread, and Fermentrack AND the ESP8266 branch of the firmware are both his: Fermentrack is "closer to the developer" in that the two were intended to work with each other. That said, BrewPi Remix does support the ESP8266. I'll support questions about a BPR installation with the ESP8266 here, as Thorrak will support Fermentrack ESP8266 here.

Despite jabbing each other in the eye, we work fairly well together. As much as a New Yorker and a Midwesterner could I guess. :)

If BrewPi is still supported can you please point me to the page or installation instruction to install BrewPi for ESP8266
The BrewPi Remix thread is here, and there's not much to it that's different. The easiest method is to flash the controller with BrewFlasher (also Thorrak's baby), and then do the install like normal (updated instructions in the docs.) Right now you'd need to do a one-line configuration change to the config.cfg to enable the ESP device.
 
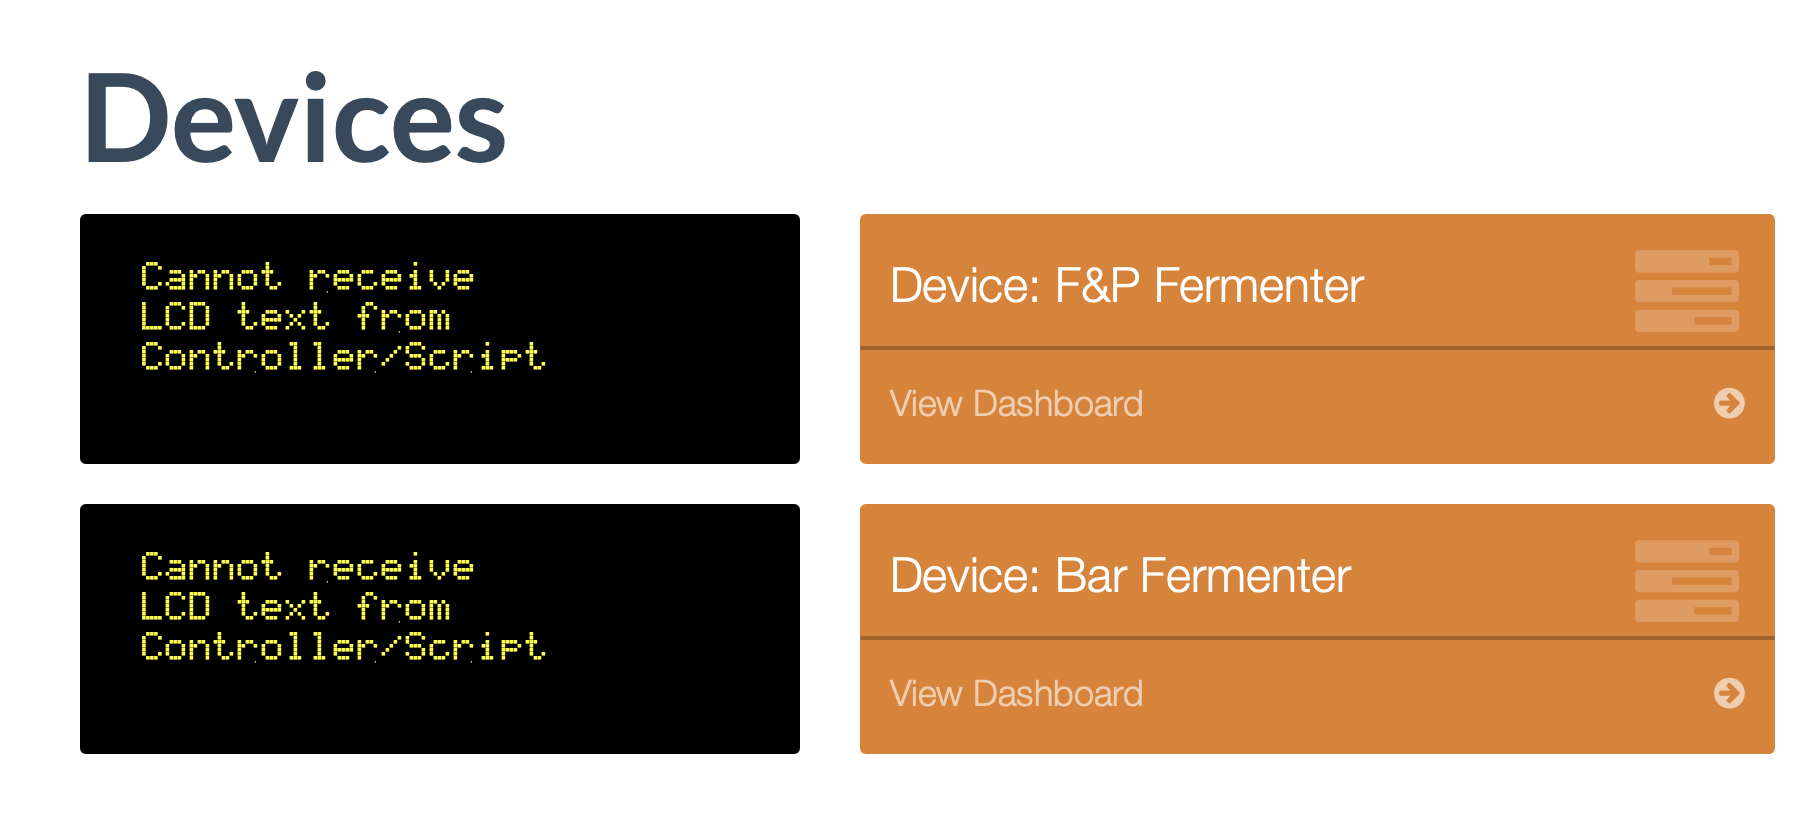
Hi guys. Ive had my RPi turned off for awhile (that has fermentrack installed on it). I turned it on today to monitor a brew I Just did and the wifi temp controllers I have wont show the LCD screen temp settings within fermentrack and wont connect to the temp controllers. . Ive tried rebooting many times but no luck. Any ideas what the problem could be? Both my temp controllers wont connect so Im thinking its a raspberry Pi or fermntrack itself problem. Here is what the debug log says.
Screen Shot 2021-05-01 at 1.29.45 pm.png


And this is what the LCD screen message shows.

Screen Shot 2021-05-01 at 1.29.59 pm.png
 
Hi guys. Ive had my RPi turned off for awhile (that has fermentrack installed on it). I turned it on today to monitor a brew I Just did and the wifi temp controllers I have wont show the LCD screen temp settings within fermentrack and wont connect to the temp controllers. . Ive tried rebooting many times but no luck. Any ideas what the problem could be? Both my temp controllers wont connect so Im thinking its a raspberry Pi or fermntrack itself problem. Here is what the debug log says.
View attachment 727661

And this is what the LCD screen message shows.

View attachment 727662

Have you updated to the latest dev version of Fermentrack?

There was an issue that was introduced back in December that caused cached IP addresses to (incorrectly) take precedence over resolvable mDNS hostnames.
 
Yes I updated a few weeks ago from memory. I noticed my wife's Apple Watch had the IP adress that one of the controllers usually has, but shutting down her Apple watch and restarting the controller didnt fix the issue. So I ended up removing them both and re adding them and that worked.
\Another issue Ive had for awhile which isn't a big deal but would be nice if I could fix it is that when I start fermentrack I get this error message shown in the image. "Unable to load gravity sensor with ID 2"

How can I remove it?

Screen Shot 2021-05-02 at 1.09.11 pm.png
 
Ok.... I upgraded to the most recent version of fermentrack.. Was running the non-docker version, now I THINK it's running the docker version.

I have no chart on the dashboard. I don't know how or why or what I need to get it back. Help!

Using Chrome developer tools, I see some interesting things:

/data/Gravity%20Devi…%20temp_graph.csv:1 Failed to load resource: the server responded with a status of 404 (Not Found)
dygraph.min.js:4 Uncaught TypeError: Cannot read property 'length' of undefined at Q.gatherDatasets_ (dygraph.min.js:4) at update_ABV ((index):624) at Object.success ((index):729) at i (jquery.min.js:2) at Object.fireWith [as resolveWith] (jquery.min.js:2) at y (jquery.min.js:4) at XMLHttpRequest.c (jquery.min.js:4)
dygraph.min.js:3 Uncaught TypeError: Cannot read property 'hasOwnProperty' of undefined at u.getForAxis (dygraph.min.js:3) at Q.getOptionForAxis (dygraph.min.js:3) at r.layout (dygraph.min.js:5) at Q.cascadeEvents_ (dygraph.min.js:3) at r.computePlotArea (dygraph.min.js:2) at Q.predraw_ (dygraph.min.js:4) at Q.resize (dygraph.min.js:4) at resizeHandler_.resizeHandler_ (dygraph.min.js:3)
flat-ui-icons-regular.woff:1 Failed to load resource: the server responded with a status of 404 (Not Found)
DevTools failed to load SourceMap: Could not load content for http://192.168.1.4/static/vendor/dygraph/js/dist/dygraph.min.js.map: HTTP error: status code 404, net::ERR_HTTP_RESPONSE_CODE_FAILURE
flat-ui.min.css:1 GET http://192.168.1.4/static/vendor/flat-ui/fonts/glyphicons/flat-ui-icons-regular.ttf net::ERR_ABORTED 404 (Not Found)
DevTools failed to load SourceMap: Could not load content for http://192.168.1.4/static/vendor/bootstrap/css/bootstrap.min.css.map: HTTP error: status code 404, net::ERR_HTTP_RESPONSE_CODE_FAILURE
 
Last edited:
Ok.... I upgraded to the most recent version of fermentrack.. Was running the non-docker version, now I THINK it's running the docker version.

I have no chart on the dashboard. I don't know how or why or what I need to get it back. Help!

Using Chrome developer tools, I see some interesting things:

/data/Gravity%20Devi…%20temp_graph.csv:1 Failed to load resource: the server responded with a status of 404 (Not Found)
dygraph.min.js:4 Uncaught TypeError: Cannot read property 'length' of undefined at Q.gatherDatasets_ (dygraph.min.js:4) at update_ABV ((index):624) at Object.success ((index):729) at i (jquery.min.js:2) at Object.fireWith [as resolveWith] (jquery.min.js:2) at y (jquery.min.js:4) at XMLHttpRequest.c (jquery.min.js:4)
dygraph.min.js:3 Uncaught TypeError: Cannot read property 'hasOwnProperty' of undefined at u.getForAxis (dygraph.min.js:3) at Q.getOptionForAxis (dygraph.min.js:3) at r.layout (dygraph.min.js:5) at Q.cascadeEvents_ (dygraph.min.js:3) at r.computePlotArea (dygraph.min.js:2) at Q.predraw_ (dygraph.min.js:4) at Q.resize (dygraph.min.js:4) at resizeHandler_.resizeHandler_ (dygraph.min.js:3)
flat-ui-icons-regular.woff:1 Failed to load resource: the server responded with a status of 404 (Not Found)
DevTools failed to load SourceMap: Could not load content for http://192.168.1.4/static/vendor/dygraph/js/dist/dygraph.min.js.map: HTTP error: status code 404, net::ERR_HTTP_RESPONSE_CODE_FAILURE
flat-ui.min.css:1 GET http://192.168.1.4/static/vendor/flat-ui/fonts/glyphicons/flat-ui-icons-regular.ttf net::ERR_ABORTED 404 (Not Found)
DevTools failed to load SourceMap: Could not load content for http://192.168.1.4/static/vendor/bootstrap/css/bootstrap.min.css.map: HTTP error: status code 404, net::ERR_HTTP_RESPONSE_CODE_FAILURE

How did you upgrade to/install the docker version?
 
How did you upgrade to/install the docker version?
Initially, it appeared as though fermentrack was unresponsive even after reboot, so I went to a command line and ran curl -L install.fermentrack.com | sudo bash. That got everything working again except for the graph. I tried switching from dev release to official release and back via the web interface.

Maybe I always had the docker version... Not really sure about that.
 
Seems like a few things aren't found looking in the log.... Not sure how to resolve this.

0.0.0.0 - - [02/May/2021 13:30:25] "GET /static/vendor/font-awesome/css/font-awesome.min.css HTTP/1.0" 304 0
0.0.0.0 - - [02/May/2021 13:30:25] "GET /static/css/custom_style.css HTTP/1.0" 304 0
0.0.0.0 - - [02/May/2021 13:30:25] "GET /static/css/dashboard_revised.css HTTP/1.0" 304 0
0.0.0.0 - - [02/May/2021 13:30:25] "GET /static/vendor/dygraph/js/dygraph.min.js HTTP/1.0" 304 0
0.0.0.0 - - [02/May/2021 13:30:25] "GET /static/vendor/jquery/jquery.min.js HTTP/1.0" 304 0
0.0.0.0 - - [02/May/2021 13:30:25] "GET /static/vendor/flat-ui/js/flat-ui.min.js HTTP/1.0" 304 0
0.0.0.0 - - [02/May/2021 13:30:25] "GET /static/vendor/vue/js/vue.min.js HTTP/1.0" 304 0
0.0.0.0 - - [02/May/2021 13:30:25] "GET /static/js/lcd.js HTTP/1.0" 304 0
0.0.0.0 - - [02/May/2021 13:30:25] "GET /static/js/gravity.js HTTP/1.0" 304 0
0.0.0.0 - - [02/May/2021 13:30:26] "GET /api/gravity/ HTTP/1.0" 200 373
0.0.0.0 - - [02/May/2021 13:30:26] "GET /static/vendor/flat-ui/fonts/lato/lato-bold.woff HTTP/1.0" 304 0
0.0.0.0 - - [02/May/2021 13:30:26] "GET /static/vendor/flat-ui/fonts/lato/lato-regular.woff HTTP/1.0" 304 0
0.0.0.0 - - [02/May/2021 13:30:29] "GET /static/vendor/bootstrap/css/bootstrap.min.css HTTP/1.0" 304 0
0.0.0.0 - - [02/May/2021 13:30:29] "GET /static/vendor/flat-ui/css/flat-ui.min.css HTTP/1.0" 304 0
0.0.0.0 - - [02/May/2021 13:30:29] "GET /static/css/dashboard_revised.css HTTP/1.0" 304 0
0.0.0.0 - - [02/May/2021 13:30:29] "GET /static/vendor/dygraph/js/dygraph.min.js HTTP/1.0" 304 0
0.0.0.0 - - [02/May/2021 13:30:29] "GET /static/vendor/moment/moment.min.js HTTP/1.0" 304 0
0.0.0.0 - - [02/May/2021 13:30:29] "GET /static/vendor/flat-ui/js/flat-ui.min.js HTTP/1.0" 304 0
0.0.0.0 - - [02/May/2021 13:30:30] "GET /api/gravity/1/ HTTP/1.0" 200 373
Not Found: /static/vendor/flat-ui/fonts/glyphicons/flat-ui-icons-regular.woff
WARNING:django.request:Not Found: /static/vendor/flat-ui/fonts/glyphicons/flat-ui-icons-regular.woff
0.0.0.0 - - [02/May/2021 13:30:26] "GET /static/vendor/flat-ui/css/flat-ui.min.css HTTP/1.0" 304 0
0.0.0.0 - - [02/May/2021 13:30:26] "GET /api/lcd/ HTTP/1.0" 200 2
0.0.0.0 - - [02/May/2021 13:30:26] "GET /static/vendor/font-awesome/fonts/fontawesome-webfont.woff2?v=4.7.0 HTTP/1.0" 304 0
0.0.0.0 - - [02/May/2021 13:30:29] "GET /gravity/sensor/1/ HTTP/1.0" 200 27810
0.0.0.0 - - [02/May/2021 13:30:29] "GET /static/vendor/font-awesome/css/font-awesome.min.css HTTP/1.0" 304 0
0.0.0.0 - - [02/May/2021 13:30:29] "GET /static/css/custom_style.css HTTP/1.0" 304 0
0.0.0.0 - - [02/May/2021 13:30:29] "GET /static/vendor/dygraph/css/dygraph.css HTTP/1.0" 304 0
0.0.0.0 - - [02/May/2021 13:30:29] "GET /static/vendor/jquery/jquery.min.js HTTP/1.0" 304 0
0.0.0.0 - - [02/May/2021 13:30:29] "GET /static/vendor/moment-timezone/moment-timezone-with-data-2012-2022.js HTTP/1.0" 304 0
0.0.0.0 - - [02/May/2021 13:30:30] "GET /api/gravity/ispindel/1/ HTTP/1.0" 200 53
0.0.0.0 - - [02/May/2021 13:30:48] "GET /static/vendor/bootstrap/css/bootstrap.min.css HTTP/1.0" 304 0
0.0.0.0 - - [02/May/2021 13:30:48] "GET /static/vendor/flat-ui/css/flat-ui.min.css HTTP/1.0" 304 0
0.0.0.0 - - [02/May/2021 13:30:48] "GET /static/vendor/font-awesome/css/font-awesome.min.css HTTP/1.0" 304 0
0.0.0.0 - - [02/May/2021 13:30:48] "GET /static/css/custom_style.css HTTP/1.0" 304 0
0.0.0.0 - - [02/May/2021 13:30:48] "GET /static/css/dashboard_revised.css HTTP/1.0" 304 0
0.0.0.0 - - [02/May/2021 13:30:48] "GET /static/vendor/dygraph/css/dygraph.css HTTP/1.0" 304 0
Not Found: /static/vendor/dygraph/js/dist/dygraph.min.js.map
WARNING:django.request:Not Found: /static/vendor/dygraph/js/dist/dygraph.min.js.map
0.0.0.0 - - [02/May/2021 13:30:48] "GET /static/vendor/flat-ui/fonts/glyphicons/flat-ui-icons-regular.woff HTTP/1.0" 404 24613
Not Found: /static/vendor/bootstrap/css/bootstrap.min.css.map
WARNING:django.request:Not Found: /static/vendor/bootstrap/css/bootstrap.min.css.map
0.0.0.0 - - [02/May/2021 13:30:48] "GET /static/vendor/dygraph/js/dist/dygraph.min.js.map HTTP/1.0" 404 24562
Not Found: /static/vendor/flat-ui/fonts/glyphicons/flat-ui-icons-regular.ttf
WARNING:django.request:Not Found: /static/vendor/flat-ui/fonts/glyphicons/flat-ui-icons-regular.ttf
0.0.0.0 - - [02/May/2021 13:30:48] "GET /static/vendor/bootstrap/css/bootstrap.min.css.map HTTP/1.0" 404 24565
0.0.0.0 - - [02/May/2021 13:30:52] "GET /gravity/sensor/1/ HTTP/1.0" 200 27810
0.0.0.0 - - [02/May/2021 13:30:52] "GET /static/vendor/bootstrap/css/bootstrap.min.css HTTP/1.0" 304 0
0.0.0.0 - - [02/May/2021 13:30:52] "GET /static/vendor/font-awesome/css/font-awesome.min.css HTTP/1.0" 304 0
0.0.0.0 - - [02/May/2021 13:30:52] "GET /static/css/dashboard_revised.css HTTP/1.0" 304 0
0.0.0.0 - - [02/May/2021 13:30:52] "GET /static/vendor/dygraph/js/dygraph.min.js HTTP/1.0" 304 0
0.0.0.0 - - [02/May/2021 13:30:52] "GET /static/vendor/flat-ui/js/flat-ui.min.js HTTP/1.0" 304 0
0.0.0.0 - - [02/May/2021 13:30:52] "GET /static/vendor/moment-timezone/moment-timezone-with-data-2012-2022.js HTTP/1.0" 304 0
Not Found: /static/vendor/bootstrap/css/bootstrap.min.css.map
WARNING:django.request:Not Found: /static/vendor/bootstrap/css/bootstrap.min.css.map
0.0.0.0 - - [02/May/2021 13:30:48] "GET /static/vendor/flat-ui/fonts/glyphicons/flat-ui-icons-regular.ttf HTTP/1.0" 404 24610
0.0.0.0 - - [02/May/2021 13:30:52] "GET /static/vendor/flat-ui/css/flat-ui.min.css HTTP/1.0" 304 0
0.0.0.0 - - [02/May/2021 13:30:52] "GET /static/css/custom_style.css HTTP/1.0" 304 0
0.0.0.0 - - [02/May/2021 13:30:52] "GET /static/vendor/dygraph/css/dygraph.css HTTP/1.0" 304 0
0.0.0.0 - - [02/May/2021 13:30:52] "GET /static/vendor/jquery/jquery.min.js HTTP/1.0" 304 0
0.0.0.0 - - [02/May/2021 13:30:52] "GET /static/vendor/moment/moment.min.js HTTP/1.0" 304 0
Not Found: /static/vendor/dygraph/js/dist/dygraph.min.js.map
WARNING:django.request:Not Found: /static/vendor/dygraph/js/dist/dygraph.min.js.map
0.0.0.0 - - [02/May/2021 13:30:53] "GET /static/vendor/bootstrap/css/bootstrap.min.css.map HTTP/1.0" 404 24565
Not Found: /static/vendor/flat-ui/fonts/glyphicons/flat-ui-icons-regular.woff
WARNING:django.request:Not Found: /static/vendor/flat-ui/fonts/glyphicons/flat-ui-icons-regular.woff
0.0.0.0 - - [02/May/2021 13:30:53] "GET /static/vendor/flat-ui/fonts/glyphicons/flat-ui-icons-regular.woff HTTP/1.0" 404 24613
0.0.0.0 - - [02/May/2021 13:30:53] "GET /static/vendor/flat-ui/fonts/lato/lato-bold.woff HTTP/1.0" 304 0
0.0.0.0 - - [02/May/2021 13:30:53] "GET /api/gravity/ispindel/1/ HTTP/1.0" 200 53
Not Found: /static/vendor/flat-ui/fonts/glyphicons/flat-ui-icons-regular.ttf
WARNING:django.request:Not Found: /static/vendor/flat-ui/fonts/glyphicons/flat-ui-icons-regular.ttf
0.0.0.0 - - [02/May/2021 13:30:53] "GET /static/vendor/flat-ui/fonts/glyphicons/flat-ui-icons-regular.ttf HTTP/1.0" 404 24610
0.0.0.0 - - [02/May/2021 13:30:53] "GET /static/favicon.ico HTTP/1.0" 200 55270
Not Found: /static/vendor/dygraph/js/dist/dygraph.min.js.map
WARNING:django.request:Not Found: /static/vendor/dygraph/js/dist/dygraph.min.js.map
0.0.0.0 - - [02/May/2021 13:31:13] "GET /static/vendor/dygraph/js/dist/dygraph.min.js.map HTTP/1.0" 404 24562
Not Found: /favicon.ico
WARNING:django.request:Not Found: /favicon.ico
0.0.0.0 - - [02/May/2021 13:31:13] "GET /favicon.ico HTTP/1.0" 404 24451
Not Found: /static/vendor/dygraph/js/dist/dygraph.min.j s
WARNING:django.request:Not Found: /static/vendor/dygraph/js/dist/dygraph.min.j s
0.0.0.0 - - [02/May/2021 13:31:45] "GET /static/vendor/dygraph/js/dist/dygraph.min.j%20s HTTP/1.0" 404 24555
Not Found: /static/vendor/dygraph/js/dist/dygraph.min.js
WARNING:django.request:Not Found: /static/vendor/dygraph/js/dist/dygraph.min.js
0.0.0.0 - - [02/May/2021 13:30:53] "GET /static/vendor/dygraph/js/dist/dygraph.min.js.map HTTP/1.0" 404 24562
0.0.0.0 - - [02/May/2021 13:30:53] "GET /static/vendor/flat-ui/fonts/lato/lato-regular.woff HTTP/1.0" 304 0
0.0.0.0 - - [02/May/2021 13:30:53] "GET /static/vendor/font-awesome/fonts/fontawesome-webfont.woff2?v=4.7.0 HTTP/1.0" 304 0
0.0.0.0 - - [02/May/2021 13:30:53] "GET /api/gravity/1/ HTTP/1.0" 200 373
0.0.0.0 - - [02/May/2021 13:44:09] "GET / HTTP/1.0" 200 8772
0.0.0.0 - - [02/May/2021 13:44:09] "GET /static/vendor/flat-ui/css/flat-ui.min.css HTTP/1.0" 304 0
0.0.0.0 - - [02/May/2021 13:44:09] "GET /static/css/custom_style.css HTTP/1.0" 304 0
0.0.0.0 - - [02/May/2021 13:44:09] "GET /static/vendor/dygraph/js/dygraph.min.js HTTP/1.0" 304 0
0.0.0.0 - - [02/May/2021 13:44:09] "GET /static/vendor/jquery/jquery.min.js HTTP/1.0" 304 0
0.0.0.0 - - [02/May/2021 13:44:09] "GET /static/js/lcd.js HTTP/1.0" 304 0
0.0.0.0 - - [02/May/2021 13:44:09] "GET /static/js/gravity.js HTTP/1.0" 304 0
Not Found: /static
WARNING:django.request:Not Found: /static
0.0.0.0 - - [02/May/2021 13:44:11] "GET /static HTTP/1.0" 404 24436
Not Found: /static/vendor
WARNING:django.request:Not Found: /static/vendor
 
Initially, it appeared as though fermentrack was unresponsive even after reboot, so I went to a command line and ran curl -L install.fermentrack.com | sudo bash. That got everything working again except for the graph. I tried switching from dev release to official release and back via the web interface.

Maybe I always had the docker version... Not really sure about that.

If you had the non-docker version before and installed the docker version over it, then your system is likely confused as to which installation to direct traffic to. Can you run the following two commands and tell me what you see for each?

ps -uU fermentrack
ps -uU sshd


Is there a way to force reinstallation of the necessary files?

Yes - we need to figure out which version (or versions) you have, uninstall the Docker version if you have both, then run a script to force redownloading/recollecting statics in the non-docker version.

I recommend upgrading to the Docker version eventually, but as there isn't yet a pathway from the non-Docker to the Docker version, I'm not recommending that just yet.
 
I'm running the February version of the Fermentrack master in a Virtual Machine on my Synology NAS, and it runs without issues. Now I tried to update to the April version, but gets the "504 Gateway Time-out". I tried to force the upgrade to the "dev" brance

sudo su fermentrack
cd ~/fermentrack
source ~/venv/bin/activate
utils/upgrade3.sh -f -b "dev"

And it runs apparently without problem, but I'm still getting 504. Any ideas?
 
I'm running the February version of the Fermentrack master in a Virtual Machine on my Synology NAS, and it runs without issues. Now I tried to update to the April version, but gets the "504 Gateway Time-out". I tried to force the upgrade to the "dev" brance


And it runs apparently without problem, but I'm still getting 504. Any ideas?

It sounds obvious, but have you tried rebooting the VM?

Edit - Going to guess you have (if you haven't, try it!) and send you some troubleshooting steps. Take a look at the PM I just sent when you have a few minutes.
 
Last edited:
If you had the non-docker version before and installed the docker version over it, then your system is likely confused as to which installation to direct traffic to. Can you run the following two commands and tell me what you see for each?

ps -uU fermentrack
USER PID %CPU %MEM VSZ RSS TTY STAT START TIME COMMAND
ferment+ 567 0.1 0.4 46808 16072 ? Sl 19:36 0:02 /home/fermentrack/venv/bin/python3.7 /home/fermentrack/venv/bin/circusd --daemon /home/fermentrack/fermentrack/utils/../circus.ini
ferment+ 571 0.2 1.2 87080 50524 ? Ssl 19:36 0:04 /home/fermentrack/venv/bin/python3.7 /home/fermentrack/venv/bin/chaussette --fd 10 fermentrack_django.wsgi:application
ferment+ 572 0.2 1.2 85568 49172 ? Ssl 19:36 0:03 /home/fermentrack/venv/bin/python3.7 /home/fermentrack/venv/bin/chaussette --fd 10 fermentrack_django.wsgi:application
ferment+ 573 0.6 1.2 94788 49936 ? Ssl 19:36 0:10 /home/fermentrack/venv/bin/python /home/fermentrack/fermentrack/manage.py run_huey
ferment+ 574 0.1 0.9 64812 37328 ? Ssl 19:36 0:03 /home/fermentrack/venv/bin/python -m utils.processmgr
ferment+ 575 3.4 0.4 46452 18928 ? Ssl 19:36 1:02 /home/fermentrack/venv/bin/python3.7 -c from circus import stats; stats.main() --endpoint tcp://127.0.0.1:5555 --pubsub tcp://127.0.0.1:5556 --statspoint tcp://127.0.0.1:5557 --log-level ERROR --log-output /home/fermentrack/fermentrack/log/circusd.log
ps -uU sshd

USER PID %CPU %MEM VSZ RSS TTY STAT START TIME COMMAND

Yes - we need to figure out which version (or versions) you have, uninstall the Docker version if you have both, then run a script to force redownloading/recollecting statics in the non-docker version.

I recommend upgrading to the Docker version eventually, but as there isn't yet a pathway from the non-Docker to the Docker version, I'm not recommending that just yet.

So what does this mean... Am I running the non-docker version? How do I uninstall the docker version?
 
Last edited:
Ok... Got it on my own. Disabled docker and ran ~/fermentrack-tools/non_docker_install/fix-environment.sh

Thanks for the guidance.
 
Ok... Got it on my own. Disabled docker and ran ~/fermentrack-tools/non_docker_install/fix-environment.sh

Thanks for the guidance.

That makes sense - that script is kind of the "nuclear option" for fixing issues. Glad to hear it worked in this case!

Is the battery data only available in the Docker version? Man, that was nice. :)

No, it shouldn't be. Make sure you're on the latest "dev" branch release when you have a second.
 
Yes I updated a few weeks ago from memory. I noticed my wife's Apple Watch had the IP adress that one of the controllers usually has, but shutting down her Apple watch and restarting the controller didnt fix the issue. So I ended up removing them both and re adding them and that worked.
\Another issue Ive had for awhile which isn't a big deal but would be nice if I could fix it is that when I start fermentrack I get this error message shown in the image. "Unable to load gravity sensor with ID 2"

How can I remove it?

View attachment 727809
Any suggestions on how to remove this error message?

Also what exactly is the Docker version and will I have that if Ive updated everytime Ive been advised there was an update?
 
Well, maybe things aren't as great as they seem... No battery info. Graph updates, but "current values" show with dashes. Not sure why; that doesn't make sense to me. Also states " Nothing to upgrade - Local copy and GitHub are at same commit "
 
Just going to remove the installation and install the docker version. I'm not going to lose anything valuable....
 
Any suggestions on how to remove this error message?

Also what exactly is the Docker version and will I have that if Ive updated everytime Ive been advised there was an update?

Error messages are stored in cookies that are on your local browser. You should be able to dismiss the message after it appears and it should go away unless it gets generated again.

That particular message is generated when you attempt to access the gravity dashboard for a sensor that doesn't exist in the database. It shouldn't reappear unless you specifically try to access a sensor's dashboard, but it's worth checking if the objects in the database are consistent. If you keep encountering it, try logging into the Django admin (Gear Icon > Django Admin button) and click on the "iSpindel Configurations" and "Tilt Configurations" links. If you see any listed that you don't see on the list in Fermentrack, delete them. Then go back to the Django admin, and check the "Gravity Sensors" link, and do the same.


There are two main types of Fermentrack installations now: Docker (containerized) installs and non-docker (non-containerized) installs. The docker version packages Fermentrack and its requirements into a "container" that can then be downloaded/run as a single unit. By contrast, the non-docker version relies on the system installation of Python, locally installed packages, etc.

The advantage to the docker setup is that issues such as the ones @dirkomatic and @Lykke have been dealing with which are caused by environmental problems are generally eliminated at the cost of a larger download and a slight bit of additional overhead.
 
Last edited:
Error messages are stored in cookies that are on your local browser. You should be able to dismiss the message after it appears and it should go away unless it gets generated again.

That particular message is generated when you attempt to access the gravity dashboard for a sensor that doesn't exist in the database. It shouldn't reappear unless you specifically try to access a sensor's dashboard, but it's worth checking if the objects in the database are consistent. If you keep encountering it, try logging into the Django admin (Gear Icon > Django Admin button) and click on the "iSpindel Configurations" and "Tilt Configurations" links. If you see any listed that you don't see on the list in Fermentrack, delete them. Then go back to the Django admin, and check the "Gravity Sensors" link, and do the same.


There are two main types of Fermentrack installations now: Docker (containerized) installs and non-docker (non-containerized) installs. The docker version packages Fermentrack and its requirements into a "container" that can then be downloaded/run as a single unit. By contrast, the non-docker version relies on the system installation of Python, locally installed packages, etc.

The advantage to the docker setup is that issues such as the ones @dirkomatic and @Lykke have been dealing with which are caused by environmental problems are generally eliminated at the cost of a larger download and a slight bit of additional overhead.
Thanks for the info mate. Ive been getting that error for ages everytime I start Fermenrack and it is from an ispindel gravity sensor I tried setting up once back when I first installed fermentrack. I tried removing it and re adding it but obviously didnt remove the original one properly. I will follow your instructions..cheers again.
 
Error messages are stored in cookies that are on your local browser. You should be able to dismiss the message after it appears and it should go away unless it gets generated again.

That particular message is generated when you attempt to access the gravity dashboard for a sensor that doesn't exist in the database. It shouldn't reappear unless you specifically try to access a sensor's dashboard, but it's worth checking if the objects in the database are consistent. If you keep encountering it, try logging into the Django admin (Gear Icon > Django Admin button) and click on the "iSpindel Configurations" and "Tilt Configurations" links. If you see any listed that you don't see on the list in Fermentrack, delete them. Then go back to the Django admin, and check the "Gravity Sensors" link, and do the same.


There are two main types of Fermentrack installations now: Docker (containerized) installs and non-docker (non-containerized) installs. The docker version packages Fermentrack and its requirements into a "container" that can then be downloaded/run as a single unit. By contrast, the non-docker version relies on the system installation of Python, locally installed packages, etc.

The advantage to the docker setup is that issues such as the ones @dirkomatic and @Lykke have been dealing with which are caused by environmental problems are generally eliminated at the cost of a larger download and a slight bit of additional overhead.


I only have the 1 gravity sensor listed in both gravity sensors and Ispindel section which is the one Im using.

Screen Shot 2021-05-05 at 5.27.32 pm.png
Screen Shot 2021-05-05 at 5.27.49 pm.png
 
I only have the 1 gravity sensor listed in both gravity sensors and Ispindel section which is the one Im using.

View attachment 728208View attachment 728209

I just read through the code, and Fermentrack actually stores messages in sessions, not in cookies like I thought. Try logging out of Fermentrack and back in. The log-out button is in the upper right to the left of the "gear".
 
I just read through the code, and Fermentrack actually stores messages in sessions, not in cookies like I thought. Try logging out of Fermentrack and back in. The log-out button is in the upper right to the left of the "gear".
No that didnt work either. I logged out and back in but when I reloaded the webpage I still have the same error message.
 
I'M NOT CRAZY! 💃

Seriously - I'm just glad I wasn't the only person experiencing that. It took me a few hours of swapping back and forth before I believed what I was seeing.
Just today I found his about sensors not working at 5v

“Maxim Integrated also produce the MAX31820 temperature sensor. The MAX31820 is a DS18B20 with limited supply voltage range (i.e. up to 3.7 V) and smaller temperature range of high accuracy. Like the DS18B20, it uses one-wire family code 0x28. Preliminary investigations have not (yet) revealed a test to distinguish between DS18B20 of Family A1 and Maxim-produced MAX31820 in software.”
 
Not really. I mean it’s possible to mount a Linux partition on a PC, then stand up the database .... honestly it’s not trivial and I would expect it would take: 1) the data being recoverable and 2) someone that was familiar with the process a few hours if it was recoverable.

My opinion is it would be easier/quicker/more sure to start over.

This is why we always recommend people get good backups regularly and never power off the Pi without shutting it down.

can u help me back up my SD card?

I have an rPi 2 (headless) running fermentrack without any problem on a 16MB card. I have a Mac laptop and card reader.

I have tried removing the sd card from rPi and backing it up through various methods with no avail.

I’ve used command line using the “dd” command, disk utility, apple pi baker, and tried using balenaEtcher methods. When I try the cloned SD card the rPi is not found in my list of devices on my home network and the usual IP address isn’t responding.

Is there something about fermentrack that prevents the back up? Do the WiFi settings have to be reconfigured after a backup?
 
Back
Top