Comparing Ward's Report to County Data

Homebrew Talk - Beer, Wine, Mead, & Cider Brewing Discussion Forum

Help Support Homebrew Talk - Beer, Wine, Mead, & Cider Brewing Discussion Forum:

This site may earn a commission from merchant affiliate links, including eBay, Amazon, and others.

CascadesBrewer

Supporting Member
HBT Supporter
Joined
Mar 24, 2013
Messages
2,945
Reaction score
3,007
Location
VA, USA
Back in February 2019 I sent off a sample of my water to Ward Labs. I have been using the data from that report for my water adjustments. I am making better been than ever, but I have made several changes to my process this year in addition to water chemistry. My measured pH numbers are usually pretty close to the predicted values.

I recently reached out to my local water company and they directed me to a location where I could get more detailed monthly data. The woman that I talked with basically said "we don't do that testing ourselves but we use the same water source and treatment as the county next door and we reference their testing."

I am wondering if I should use the county data to tweak my numbers? I know my tap water likely varies from month to month. Should I just be happy that I am making good beers using my report?

I grabbed what they had so far for 2019 and compared it to my Ward Labs report. The average Sodium and Chloride from the county is generally lower than the report. [The Orange-ish cells are tested quarterly, Nov/Dec data is not posted, and not all Oct data is reported.]

Water Table Data.PNG


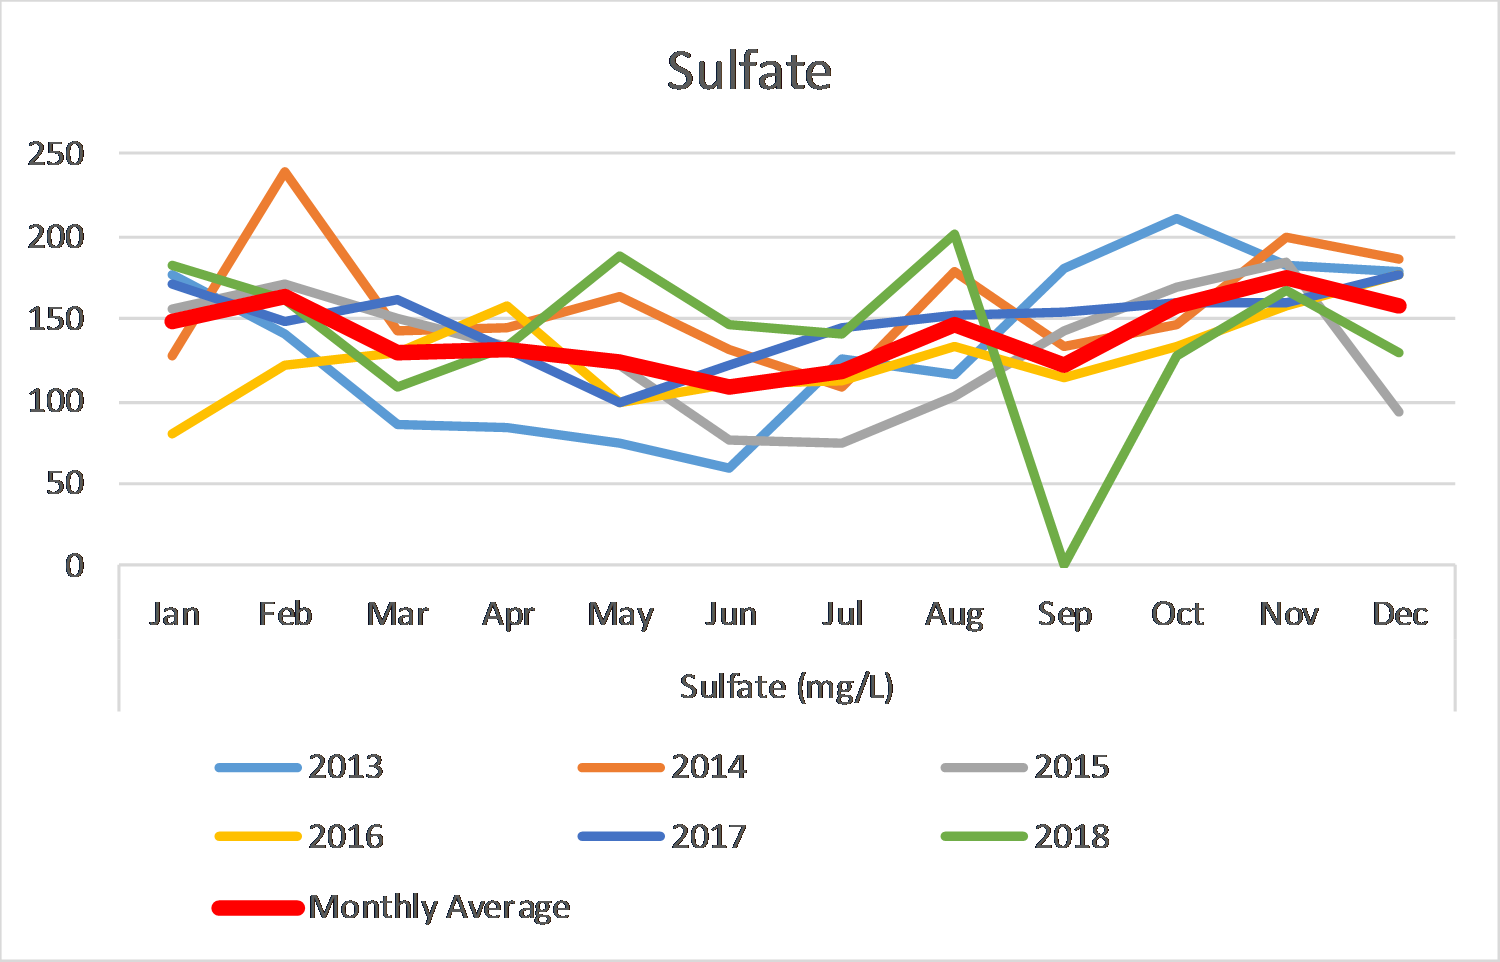
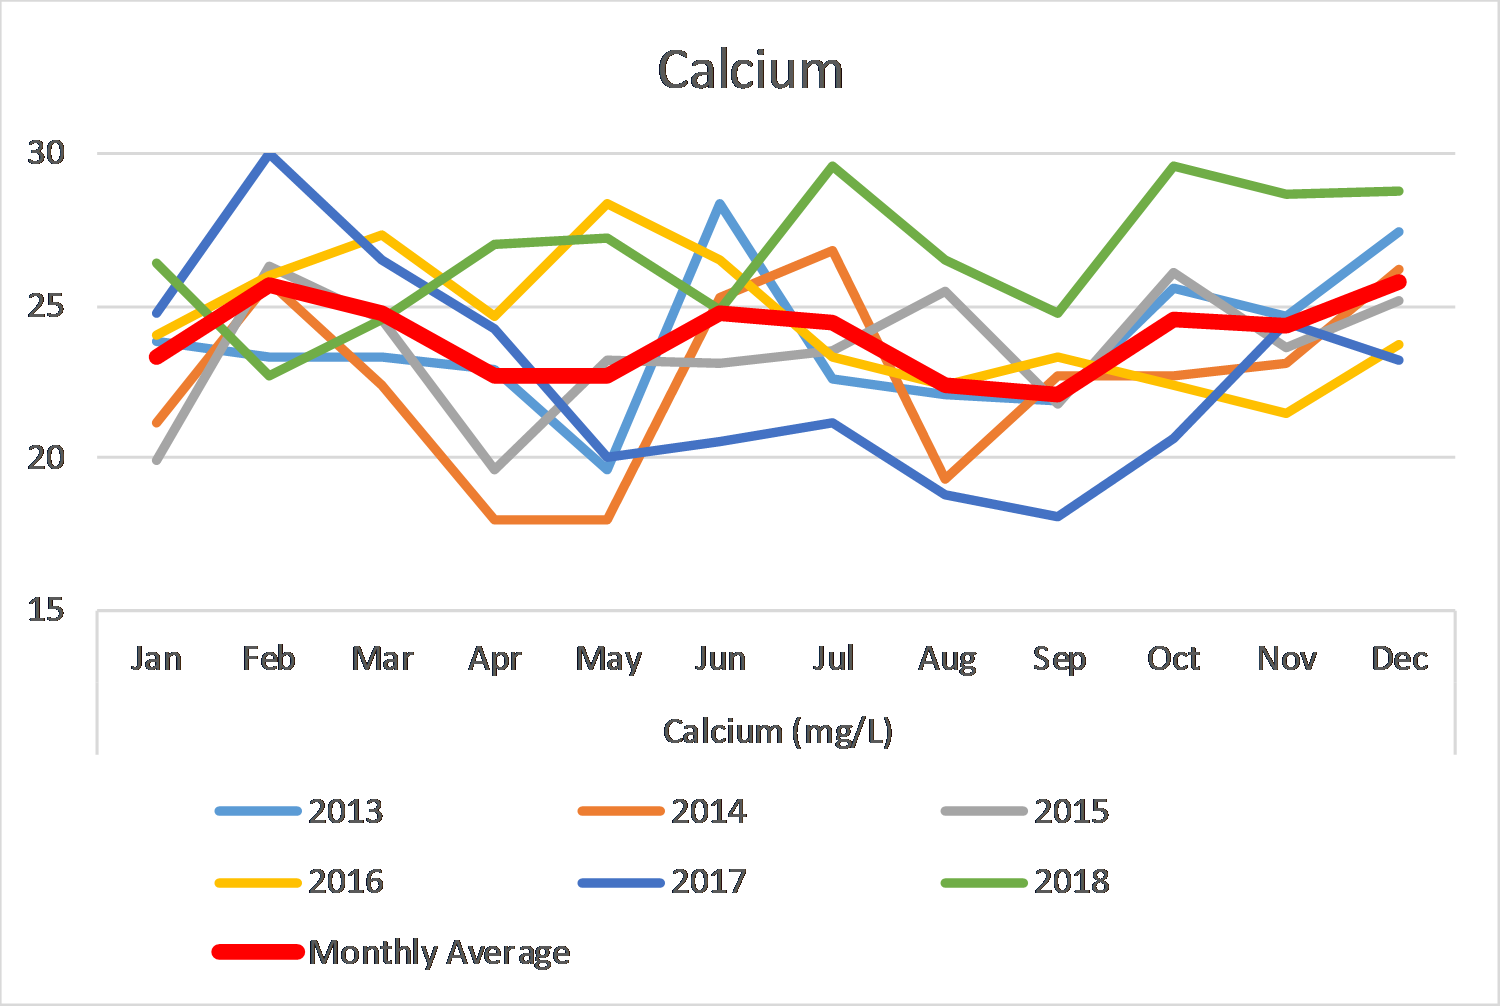
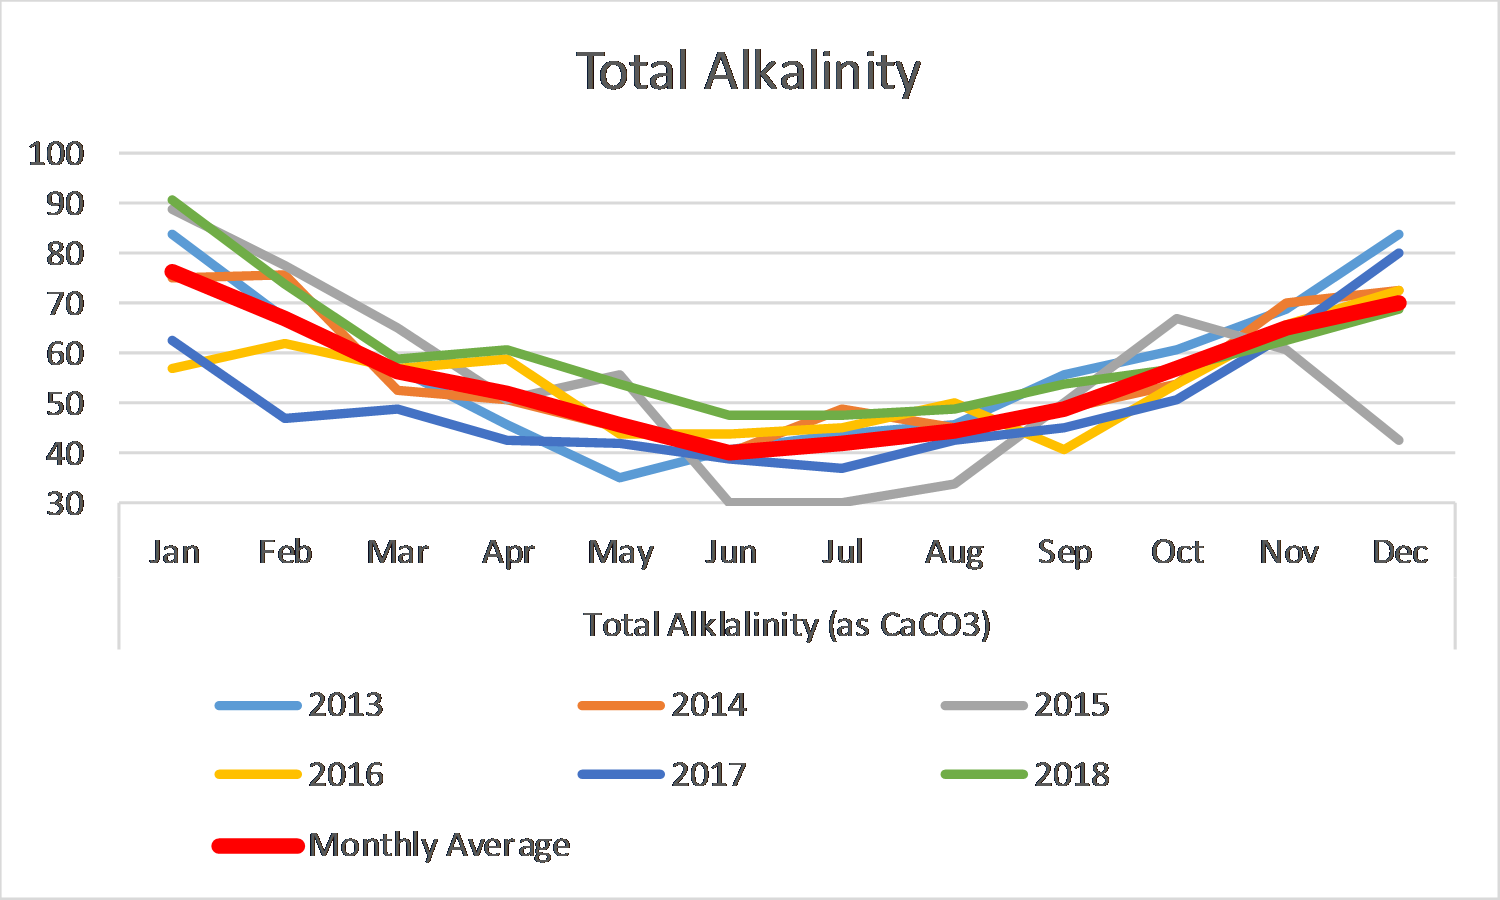
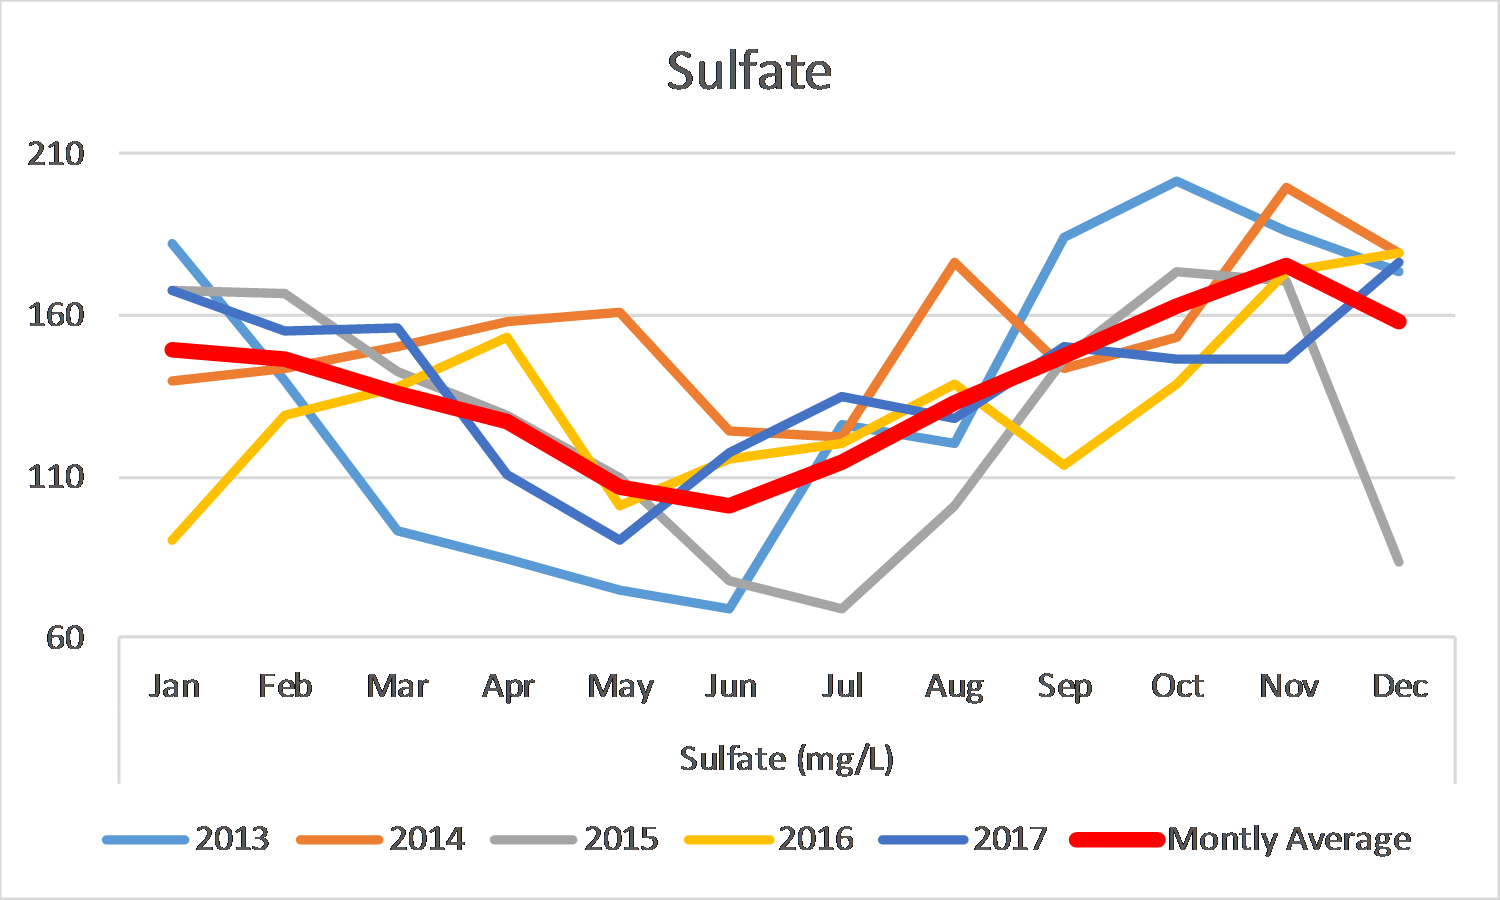
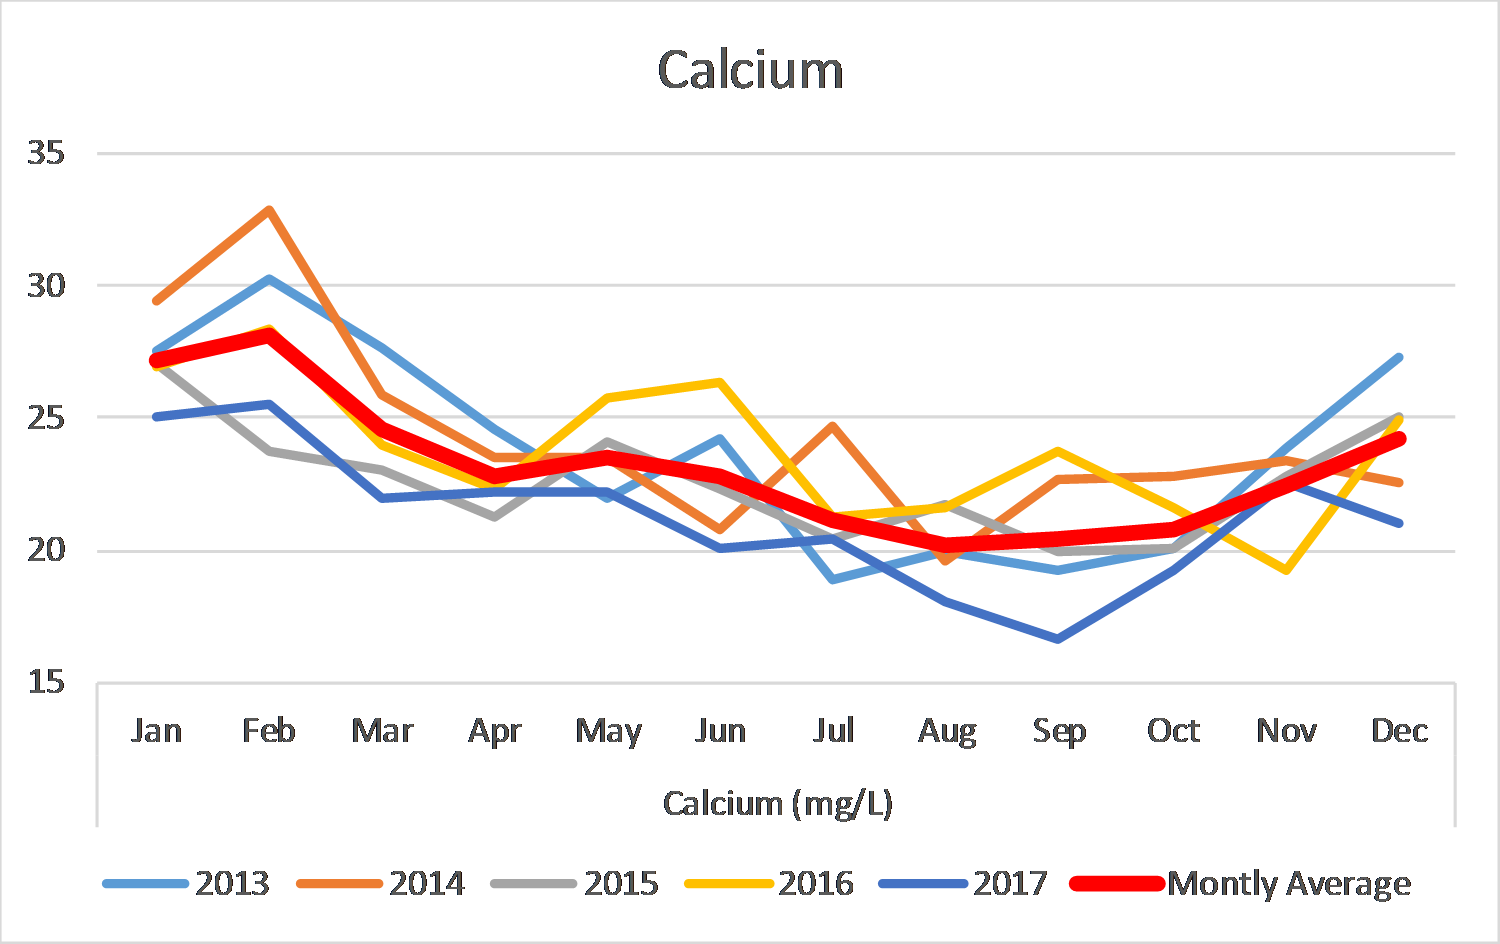
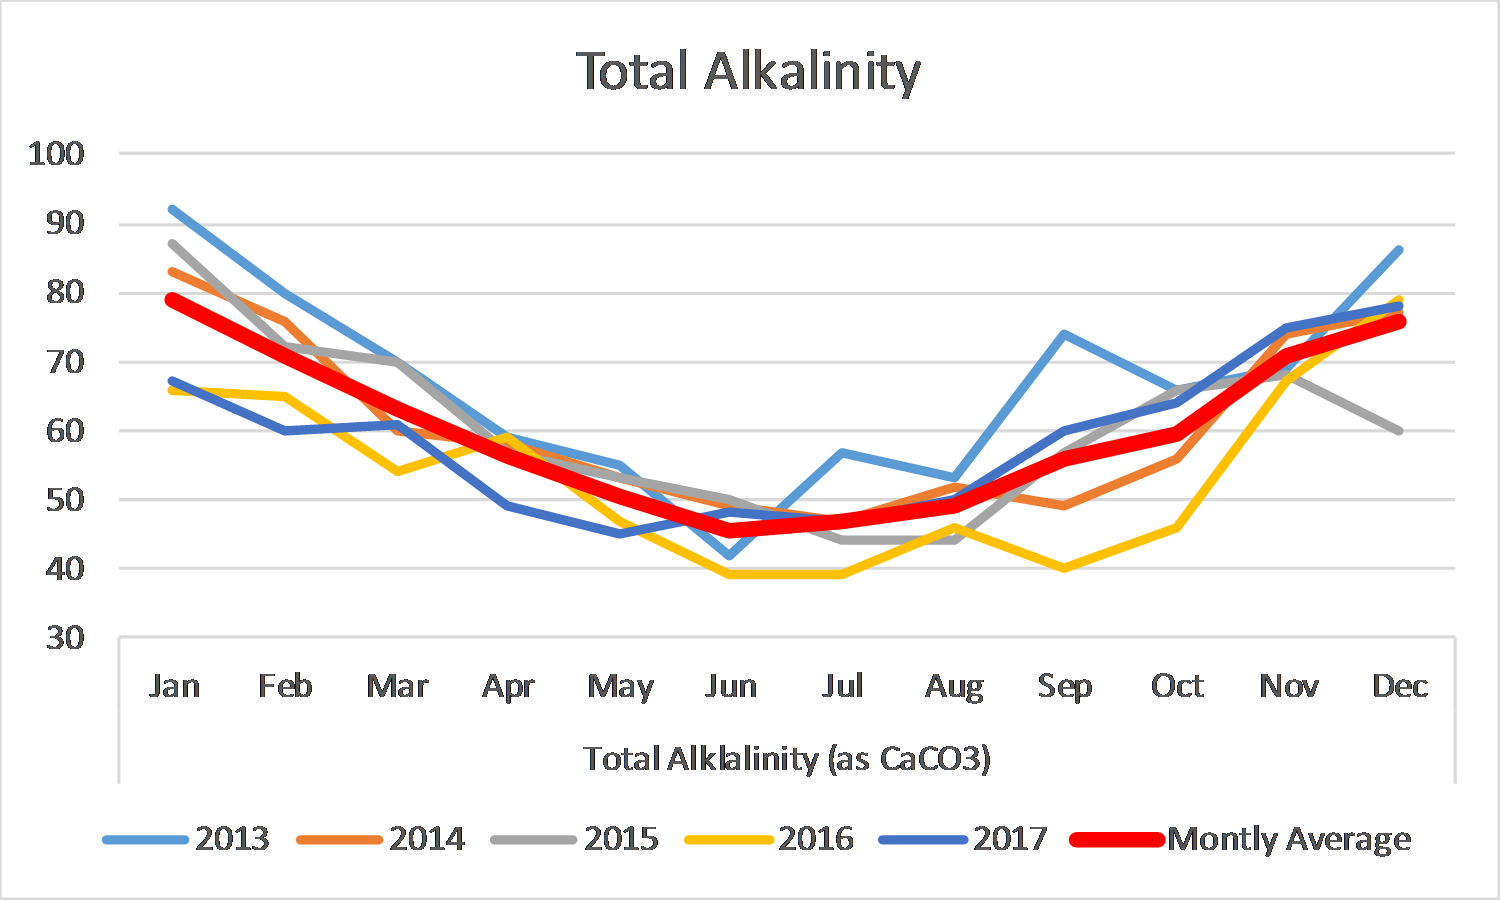
Here is a chart of the data. I am not sure I see an drastic trends, other than a slight dip in May and some higher numbers in the fall. I have not looked at past years to see if there is a trend. They seem to always post a report from early Dec that does not have Dec data.

Water Chart Data.PNG
 
Last edited:
Excellent data research, kudos for the effort.
I suppose if you could access the monthly data prior to your brew days you could literally tune your additions on that basis, but even a Type A like myself would willingly concede that's a bit nutty ;)

Based on your work and the apparent deviation from average I would go with the statistical average and call it done...

Cheers!
 
I've been thinking about a similar thing. I know my actual water profile varies through the year and from year to year; I have typically regularly tested the most important (to me) parameters (Ca and total alkalinity) myself. My water utility provides annual reports (always a year behind) giving high, low, and average values. I've decided that the real question is this: let's say we assume a typical, average profile for our supply and use it in our software for every brew we plan. Will any of the actual, seasonal variations be so extreme that our "one size fits all" assumptions will result in something falling significantly outside an acceptable range? I.e., mash pH way out of range, offensive sulfate level, just not enough calcium, etc.? Do some calculations using the more extreme values that surprise you in the detailed spot reports, applying a water treatment plan based on your previous assumptions. See if you ever get scared.
 
That can be a good approach. For many brewers it might be obligatory. But over time, I've realized that there are limited circumstances in which employing RO, even as dilution water, is necessary for me. In most cases, I can deal with my natural source water. This is philosophically appealing, and simplifies process.
 
spend $100 on a RO filter and never wonder again.

How much annual maintenance is required in the way of replacing filters? I assume the system has a lifespan as well. I am not always that good about planning brewing sessions in advance. I just don't see an RO system fitting in with me. The local Walmart sells RO water for around $0.40/gal. If I was not happy with the beers I make using tap water, I would likely go that route...and I have it somewhere on my todo list to do some experiments with tap/RO/treated-tap.

Thinking about my report...I suspect that the sodium level in my water is likely generally lower than the Ward's report says. Not a big deal but it means I don't have to feel too bad about using Baking Soda for a dark beer. On average my tap water Sulfate is likely a bit higher that the Ward's report and my Chloride is likely a little lower. I might make some small tweaks to my additions moving forward, but nothing drastic. Maybe I will get another Ward's report in July.
 
New prefilters about every year at 10 bucks total. New membrane every 3 years give or take at 25 bucks. I use a cheap TDS meter as my guide on that. Hauling water sucks.
 
Water composition can vary wildly on a day-to-day basis, so even the report you got from the sample you sent off last week could already be outdated. I've long since switched to RO water and the displayed TDS value at the input port of my RO unit can swing from a maximum value of aroun 270 ppm to as low as 140 ppm in as little as 48 hrs. That's municipal water drawn from deep artesian wells, surface water sources are way worse that that for obvious reasons.
 
Water composition can vary wildly on a day-to-day basis, so even the report you got from the sample you sent off last week could already be outdated.
True for some, false for most. But it’s worth knowing about. It’s often an emergency switch to an alternative water source that causes a change. Water suppliers strive to keep their quality consistent, but it’s not always possible. This is when it’s good to understand your water source.

Prefilters for RO machines often don’t require annual replacement. The ability to monitor the performance of those filters is key. The current issue of Zymurgy magazine teaches you how to modify your system to allow monitoring and how to test. This is another reason why AHA membership is worth while.
 
I've been thinking about a similar thing. I know my actual water profile varies through the year and from year to year; I have typically regularly tested the most important (to me) parameters (Ca and total alkalinity) myself. My water utility provides annual reports (always a year behind) giving high, low, and average values. I've decided that the real question is this: let's say we assume a typical, average profile for our supply and use it in our software for every brew we plan. Will any of the actual, seasonal variations be so extreme that our "one size fits all" assumptions will result in something falling significantly outside an acceptable range? I.e., mash pH way out of range, offensive sulfate level, just not enough calcium, etc.? Do some calculations using the more extreme values that surprise you in the detailed spot reports, applying a water treatment plan based on your previous assumptions. See if you ever get scared.

I went through the same musing about a year ago - specifically wondering if there were any sorts of predictable seasonal variations. Fortunately, the water department folks here are pretty accommodating and sent me monthly summary reports for the previous 5 years for both of the treatment plants used in the STL metro area. Well, there kind of was, but the basic take-homes were that month to month variation was pretty substantial, as was year-to-year variation. Basically, the previous years' average wasn't really that great, and accounting for seasonal/monthly trends probably wasn't that useful. Granted, this is n=2, but I'd imagine the situation is similar for lots of folks.

Plant 1 (COR):
qqzlJjN.png

RkO0QxI.png

K7UfQKu.png


Plant 2 (HB):
tVMK9ZF.png

cyBoeLL.png

IVLdhHn.png

spend $100 on a RO filter and never wonder again.
So, I just ended up doing this so I wouldn't have to guess :)
 
I went through the same musing about a year ago - specifically wondering if there were any sorts of predictable seasonal variations. Fortunately, the water department folks here are pretty accommodating and sent me monthly summary reports for the previous 5 years for both of the treatment plants used in the STL metro area. Well, there kind of was, but the basic take-homes were that month to month variation was pretty substantial, as was year-to-year variation. Basically, the previous years' average wasn't really that great, and accounting for seasonal/monthly trends probably wasn't that useful. Granted, this is n=2, but I'd imagine the situation is similar for lots of folks.

Plant 1 (COR):
qqzlJjN.png

RkO0QxI.png

K7UfQKu.png


Plant 2 (HB):
tVMK9ZF.png

cyBoeLL.png

IVLdhHn.png


So, I just ended up doing this so I wouldn't have to guess :)
I found that in my case, the seasonal variations may look significant at first glance, but year to year the water is quite consistent, and the seasonal variations really aren't significant enough to put me too far off if I assume average values. That said, there are some beers that won't work at all with this water, so I use RO when needed.
 
So, I just ended up doing this so I wouldn't have to guess :)

Thanks for sharing. I might have to move my RO experiments up further on the priority list...though I have been quite happy with my beers lately.

Does @ajdelange brew beer when in VA? I might have the same water source as him (surface water with Potomac River the primary source).
 
Back
Top