Do "professional" brewers consider brulosophy to be a load of bs?

Homebrew Talk - Beer, Wine, Mead, & Cider Brewing Discussion Forum

Help Support Homebrew Talk - Beer, Wine, Mead, & Cider Brewing Discussion Forum:

This site may earn a commission from merchant affiliate links, including eBay, Amazon, and others.
Status
Not open for further replies.
Thanks Denny, I kind of knew this, but was trying to be cheep. :D It is not like I'm not putting 4 or 5 hours aside on brew day and I have always mashed for at least an hour, usually longer because I forget to get my strike water hot early. Anyway, thanks for the reminder.

:off: Question: If I want more unfermentable sugars is a shorter mash an option? I understand a higher mash temp (156-160f) does this, but it would be good to know. :mug:

Theoretically, yes. But malt these days in so high in diastatic power that mash length and temp make less difference than they used to. I mashed recipe at 153 and 168 and found no detectable difference in body or flavor and the OG and FG were the same on both. That's only a single data point, but it's interesting enough that I want to look into it further.
 
Theoretically, yes. But malt these days in so high in diastatic power that mash length and temp make less difference than they used to.

I love Scottish ales, and I have had the same experience. Some I mashed at 150 and some at 158 or so and I didn't notice the difference. Although they may have been months apart. I also used long boil times for both, usually 90 to 120 mins. The kettle caramelization does add to the body and unfermentables. :mug:
 
I guess I don't understand how diastatic power is germaine to the conversation at hand.
 
I love Scottish ales, and I have had the same experience. Some I mashed at 150 and some at 158 or so and I didn't notice the difference. Although they may have been months apart. I also used long boil times for both, usually 90 to 120 mins. The kettle caramelization does add to the body and unfermentables. :mug:

Although there are chemical reactions that take place in the kettle, caramelization isn't one of them. Unless you're referring to pulling some wort and doing a boildown.
 
ponder
In 1813 the British chemist Edward Charles Howard invented a method of refining sugar that involved boiling the cane juice not in an open kettle, but in a closed vessel heated by steam and held under partial vacuum. At reduced pressure, water boils at a lower temperature, and this development both saved fuel and reduced the amount of sugar lost through caramelization.
 
We live in a world where psychology has a huge influence over every aspect of our lives, where global warming is taken seriously, and xx or xy chromosone is all but ignored. I'm thinking there's no need to distinguish between science and "real" science where brewing beer is concerned.
 
Here's a bit more perspective on the confusions caused by Brulosophy's misinterpretation of significance (p). There are two types of problems of interest.


  1. We make a change in materials or process in the expectation that the beer will be improved. We hope that most of our 'customers' will notice a change.
  2. We make a change in materials or process in order to save time and/or money. We hope that few, if any, of our 'customers' will notice a change.

'Customers' is in quotes because while in the case of a commercial operation they are literally customers, in the home brewing case they are our families, friends, colleagues or brew club members (or all of these).

The two cases are quite distinct and call for different interpretations of triangle test results. In the first case we do not want to be misled by our interpretation of the test data into thinking that there is a difference in the beers when in fact there isn't. We want the probability of this kind of error (Type I) to be quite low. In the second case we don't want to be misled into thinking that there is no difference when in fact there is. We want the data to imply that the probability of this kind of error (Type II) is quite low.

Suppose we have two lagers; one brewed with a triple decoction mash and one brewed with no decoctions (melanoidin malt instead). Further suppose that these beers are presented to a panel of 40 and 14 of these correctly detect the difference. Brulosophy would plug these numbers into the p formula or table and come up with p = 0.47 and declare the test to be not significantly significant and those with a passing familiarity with statistics (and, unfortunately, quite a few well acquainted with them too) would declare the test to be of no statistical significance and thus flawed.

Thus far we have determined that if the null hypothesis is true (decoction makes no difference) the probability of getting 14 or more correct answers is 47%. A brewer considering going to the extra trouble of decoctions would like to see that the probability of getting 14 under the null hypothesis is very much lower than that which would mean that the null hypothesis isn't the correct one is low and that, therefore, the alternate hypothesis (that it does make a difference) is true. These data don't show that so this brewer would probably decide that the evidence that decoction makes perceptible change isn't very strong and would probably decide that he should not bother with it. The data is not that useable to him but is still sufficiently so for him to decide on a course of action. This does not mean the data aren't significant and should be tossed on the scrap heap while the investigators wring their hands trying to discover what they did wrong.

To see this we look at the data from the perspective of Item 2, i.e. of the brewer that has been doing decoctions and wants to see if he can get away with dropping them in favor of melanoidin malt. He looks at the significance of the test with respect to Type II errors. He assumes that there IS a difference and wants to determine what the probability of getting the test data under that assumption would be. Things are not quite symmetrical here as there is only one null hypothesis which is that the beers are not differentiable whereas there are an infinite number of alternate hypotheses e.g. that 1% of the population can differentiate them, that 2% can differentiate them, that 2.47651182% can differentiate them and so on. So he decides he'll drop decoctions if 20% or less of his 'customers' can detect a difference. He now computes the probability of getting 9 or fewer correct answers in a beer that is 20% detectable (he can do the computation with the spreadsheet I offered earlier) and finds that probability to be 0.0495. He can, therefore, be quite confident from these data that he can drop the decoctions and thus the same test which was not statistically significant to the guy considering adding decoctions to his process is now seen to be significant to the guy considering dropping them.

To return this to the original question: a pro brewer who is aware of this aspect of the triangle test might extract some useful guidance from the Brulosophy tests (though he would want to see some improvements in the way they conduct them). Finding a pro brewer who has this awareness, however, would probably not be easy. You'd have to hang out in the hospitality suites at ASBC or MBAA meetings. The guys you'd find who knew about this probably wouldn't be brewers but rather the professors and lab rats that go to these things. And I'll note that the ASBC's MOA mentions nothing of Type II error (though I have not seen the latest version of it).

Really intetesting way of looking at different sides and perspectives of data. I enjoy your posts much, thanks
 
'Customers' is in quotes because while in the case of a commercial operation they are literally customers, in the home brewing case they are our families, friends, colleagues or brew club members (or all of these).

Thus what Brulosophy has done is very applicable to home brewers who want to improve their products or potentially save time - if said home brewers know how to interpret Bruslosohy's findings. It would, of course, help immensely if Brulosophy did too.
 
Come on, man! Who amongst us hasn't sat down over a home brew and argued P-values all night!? :mug:

:D

Me, for one...;)

I've said it before and I'll say it again...take these experiments for what they are, not what you want them to be. Use them to find out for yourself. We're making beer at home, not looking for a cure for cancer.
 
I've said it before and I'll say it again...take these experiments for what they are, not what you want them to be. Use them to find out for yourself. We're making beer at home, not looking for a cure for cancer.

Well said Denny.

It would be nice if the Brulosophy experiments were more accurate, but I take them for what they are.. unreliable. Therefore I ignore their results and do my own testing.

As for the amount of effort one puts into ones beer, that of course is a personal decision. I go by the axiom that anything worth doing, is worth doing right. Mediocre beer is ubiquitous. To each his own though.
 
What I'd like them to be is a source of useful information and they are if you know how to interpret the results properly. Why are you so offended that some of us would like to know what the experiments can potentially tell us beyond that some guys brewed some beer hot and some cold and couldn't draw a conclusion as to whether it made a difference? And they brewed some beers with loose hops and packaged hops and couldn't tell whether it made a difference, or they tried Hochkurz and couldn't tell whether it made a difference. Properly interpreted there is quite a bit of information of value in the actual results even though it is clear that they generally used a panel size that was too small and made other errors as well.

Of course in many cases, because of the small panel size, one really can't draw reasonable conclusions but in others one can. Here's the data from the first few on the list of all the experiments. It's a pain to read I know. I've seen tables here but darned if I know how to put one in. All the Type II numbers are for a hypothesized 20% differentiability.

Experiment ; Panelists ; No. Correct ; p Type I ; p Type II ; MLE Pd ; Z ; SD ; Lower Lim ; Upper Lim)
Hochkurz ; 26 ; 7 ; 0.815 ; 0.012 ; 0.000 ; 1.645 ; 0.130 ; 0.000 ; 0.215
Roasted Part 3 ; 24 ; 10 ; 0.254 ; 0.245 ; 0.125 ; 1.645 ; 0.151 ; 0.000 ; 0.373
Hop Stand ; 22 ; 9 ; 0.293 ; 0.226 ; 0.114 ; 1.645 ; 0.157 ; 0.000 ; 0.372
Yeast Comparison ; 32 ; 15 ; 0.078 ; 0.441 ; 0.203 ; 1.645 ; 0.132 ; 0.000 ; 0.421
Water Chemistry ; 20 ; 8 ; 0.339 ; 0.206 ; 0.100 ; 1.645 ; 0.164 ; 0.000 ; 0.370
Hop Storage ; 16 ; 4 ; 0.834 ; 0.021 ; 0.000 ; 1.645 ; 0.162 ; 0.000 ; 0.267
Ferm. Temp Pt 8 ; 20 ; 8 ; 0.339 ; 0.206 ; 0.100 ; 1.645 ; 0.164 ; 0.000 ; 0.370
Loose vs. bagged ; 21 ; 12 ; 0.021 ; 0.772 ; 0.357 ; 1.645 ; 0.162 ; 0.091 ; 0.624
Traditonal vs. short ; 22 ; 13 ; 0.012 ; 0.830 ; 0.386 ; 1.645 ; 0.157 ; 0.128 ; 0.645

In any case the Hochkurz data shows good support (p = 0.012) for the hypothesis that no more than 20% of tasters will be able to detect that it makes a difference.The Traditional vs Short test shows strong (0.012) support for the hypothesis that doing things properly makes a difference. The yeast comparison test shows fair support for the hypothesis that yeast strain makes a difference. The hop storage test shows strong ( 0.021) for the hypothesis that the storage methods compared don't make much difference. Etc.

It's true that robust conduct of a triangle test leads to some issues but getting the statistics part right (choosing proper panel size, interpreting the data) is pretty simple if you own a laptop that runs Excel. The attitude that one is doing things in a half assed fashion when it requires little more effort to do it right but who cares doesn't seem justified. If you don't care about the value of your work, why bother to do it at all?
 
Professional brewers don't want to tell you nada, the just wanna keep it all up their sleeve.

I haven't found that to be true at all. Anytime I visit a brewery and have a question about a yeast they use or a temperature or contents of a spice mix they use they're super excited to talk about it with a fellow Brewer and do everything except write down the exact recipe for you.
 
  • Like
Reactions: Kee
Me, for one...;)

I've said it before and I'll say it again...take these experiments for what they are, not what you want them to be. Use them to find out for yourself. We're making beer at home, not looking for a cure for cancer.

I have a lot of respect for you and what you've done for the homebrewing community, but this is, honestly, a very defensive looking post. If you don't enjoy the discussion going on here, then you're free to ignore it.

As AJ said, some of us want to know what the numbers are actually saying, because as we've seen from a few posters in this thread (and even more so ALL OVER THIS SITE), people are taking these exbeeriments and saying, "See none of this **** matters!" Yet we all know from our own experiences that it often does.

Now we know from looking further into the data, that them (or maybe just the crazies who go around claiming it for them) saying that it's not significant might not be true. Because for most of them, they haven't reached a low enough threshold in order to say, "see this doesn't matter." The only thing they've proven with some of these is that it *might not* matter. But then when we see it taken from a larger sample size, the numbers say, "actually this likely does matter."

This stuff is important to us. Sure, it might not be attempts at curing cancer, but that doesn't mean we don't find significance in this sort of discussion in OUR lives. That's all there is to it. If you don't enjoy the fact that some of us are enjoying the discussion, then, again, you're free to ignore it.

I'll also add that this discussion can help people understand how all science is reported on, especially in the popular press/media.

Too many headlines start off with "studies say...." when the results aren't actually what the headline says.

Everyone can benefit from a greater understanding of science, statistics, and interpretation of data.

Oh, so you're saying that this sort of discussion can have implications above and beyond just homebrewing?

Well, who cares!? Because it's not curing cancer...
 
heck I am just learning about double and triple bonds and the periodic table of the elements, I need all the science I can git! %)
 
@aj

I am trying really hard to understand the type 1 and 2 examples. I feel I am very close, can you maybe put it a little easier, if possible, for me? I would appreciate it. I am starting to get the idea of going less than 14 in one case vs the other but just cant quite put it all together. Thanks again I would appreciate it.

;)

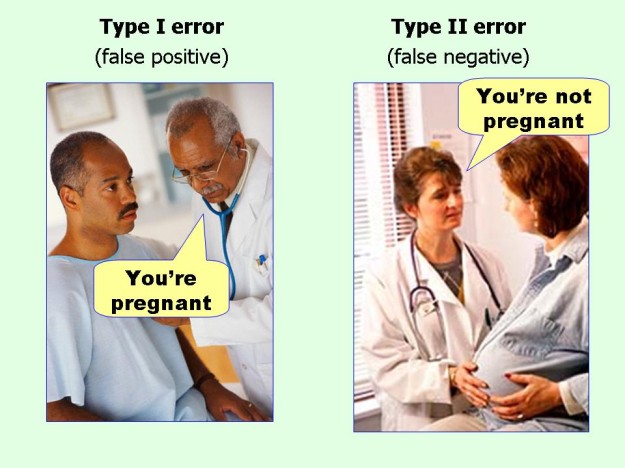
Type-I-and-II-errors1-625x468.jpg
 
@aj

I am trying really hard to understand the type 1 and 2 examples. I feel I am very close, can you maybe put it a little easier, if possible, for me?

It's a little tricky to explain because it is a bit like trying to figure out what the sentence "It's likely that you will find the statement that most people don't like Mozart to be untrue." means.

Do you own a fish finder? If so think about that. If you set the sensitivity too low the screen is all white even though Moby Dick is under the boat. This is Type II error (false dismissal). If you set the gain too high the screen becomes cluttered with targets that aren't actually there. These represent Type I errors (false alarms).
 
to the actual question posted-

i have seen posts that seem useful, pro or homebrewer-- flavor profiles on a new hop, swapping malts/yeasts in a recipe to compare and contrast. that's something you could rely on to try out a new recipe. to the original point- dont think anyone in pro world is changing their operations based on the "results"

reminds me of a marketing vehicle in the guise of a science program. ala Dr Oz. a bit of science on top of product placements, branding, merchandising, sponsorships, etc. its friggin brilliant. enough science to seem meaningful, but no claims to be definitive. "more testing needed" is the equivalent of "tune in next week". people look, and read, and debate it endlessly. even pay for access. virality personified. great business i'd think.

for actual science there's the brewers association, the big schools domestic and abroad, hop growers/brokers funding research and experiments, yeast labs doing all kinds of new research, and so on and so forth. granted, not all, or not even much of that info is available to homebrewers. so they fill the void.

have met some. nice guys. beer lovers, no doubt. dont want to sound harsh or condescending. in summary, i think infomercial might be a little too harsh.....maybe info-tainment? all with a grain of salt.
 
I'll also add that this discussion can help people understand how all science is reported on, especially in the popular press/media.

Too many headlines start off with "studies say...." when the results aren't actually what the headline says.

Everyone can benefit from a greater understanding of science, statistics, and interpretation of data.

I basically never trust the media. There's a simple test:

Take a subject that you're an expert on. Read basically any mainstream journalist discussing the subject, and ask yourself whether their take on it is accurate. You'll find, FAR more often than not, that it's nowhere close.

Once you realize that, you realize that their reporting on all the issues that you're not an expert on is equally suspect.

I never expect a non-technical reporter to get the technical stuff exactly right. And headlines are written to sell newspapers (or page views). But the popular phrase "I never trust the media" often means "they are deliberately lying to us", which is quite a different proposition.
 
  1. We make a change in materials or process in the expectation that the beer will be improved. We hope that most of our 'customers' will notice a change.
  2. We make a change in materials or process in order to save time and/or money. We hope that few, if any, of our 'customers' will notice a change.

The two cases are quite distinct and call for different interpretations of triangle test results. In the first case we do not want to be misled by our interpretation of the test data into thinking that there is a difference in the beers when in fact there isn't. We want the probability of this kind of error (Type I) to be quite low. In the second case we don't want to be misled into thinking that there is no difference when in fact there is. We want the data to imply that the probability of this kind of error (Type II) is quite low.

I'd think in the first case we would actually want both our customers to notice the difference and to show a preference for one or the other. If planning to make such a change I'd want to be convinced customers will be able to tell the difference, and that they show a preference for the more expensive process.

In the second case since we are hoping customers don't notice the change so there would be an expectation going into the study that the preference data will not be meaningful.


To be honest I still get lost in the math and have taken statistics and am not repelled by the science. But I'd of reached the same conclusions as your two hypothetical brewers in this example simply by looking at 14/40 result. A third of 40 is 13.34 you are right on top of expected result from random chance. Are the beers the same? Who knows. But no indication from this experiment that customers can tell them apart. In first example I am probably going to look for something else to do to improve my product. Maybe an investment in packaging or distribution will be more meaningful.

In second case I am not going to be inclined to triple decoct for a competition or when brewing for "customers" that won't be impressed by the label. However if I have a situation where triple decoction can be part of my labeling/branding and have customers--say other brewers/homebrewers--that will find that label appealing, then I'm probably not convinced by the study that I should stop doing it. Triangle tasting is very different from pouring a pint of beer and saying "hey come taste my triple decocted lager".
 
I never expect a non-technical reporter to get the technical stuff exactly right. And headlines are written to sell newspapers (or page views). But the popular phrase "I never trust the media" often means "they are deliberately lying to us", which is quite a different proposition.

A different proposition, so what? The media does engage in deception and lying; "deliberate" is superfluous as a lie is deliberate by any definition.
 
I'd think in the first case we would actually want both our customers to notice the difference and to show a preference for one or the other. If planning to make such a change I'd want to be convinced customers will be able to tell the difference, and that they show a preference for the more expensive process.

I agree 100% but am, at this point, in a bit of a quandary over this. In my earliest posts in this thread I said that a triangle test consisted of two parts in the first of which panelists were asked to pick the odd beer and then those who correctly picked the odd beer were asked whether they preferred it to the others. I made that assertion because when I was first introduced to triangle testing via the ASBC MOAs that's how the test was described. There were two tables in the MOA. One for significance levels on the odd beer selection and one for the paired test. That second table is not in the current version of the MOA. Beyond this the ASTM triangle procedure specifically states that one should NOT pair a preference question with the odd beer question as having to select the odd beer biases ones choice of the preferred beer. I cannot for the life of me see how this would be the case. I'm still thinking about this. I know I should go delve back into the ASBC archives (if I remembered to pay my dues this year) but am currently working on being sure that I understand the first part of the test (odd beer selection) thoroughly. Insights keep coming.

In the second case since we are hoping customers don't notice the change so there would be an expectation going into the study that the preference data will not be meaningful.

In this case if the sales loss from the cheaper process isn't greater than the cost savings you are ahead of the game and don't care that some small percentage of the customer base doesn't like the beer any more. But suppose you decide to try adding more rice and water and less barley and find the customer base prefers the new beer! Nirvana! Bud Light. So you may care about preference in this case too.


To be honest I still get lost in the math and have taken statistics and am not repelled by the science.
I do too. I've been doing this stuff since the late 60's but still have to check on which is Type I and which is Type II error. And every time I have to do that I picture Kevin Klein in "A Fish Called Wanda" asking "What was the middle thing?" I do believe, however, that AZ_IPA has forever solved that problem for me. It's the look on that guy's face.

But I'd of reached the same conclusions as your two hypothetical brewers in this example simply by looking at 14/40 result.
I've often stepped back after an analysis and said to myself "Why did I go to all that trouble? It's kind of obvious from the raw data!" If we have enough data it usually isn't necessary to do more than look at the mean and standard deviation and, based on experience, draw a conclusion. It's often obvious whether that conclusion is 'significant'. We use statistics when we don't have enough data. Statistics attach a number to our uncertainty. We can declare that p < 5% for a test to be meaningful. How about p < 7.2%. Are you really that much more assured at 5% than 7.2%. In either case you are uncertain.

Looking at several of the Brulosophy tests as I did a couple of posts back it is clear that the main criticism that could be leveled against them is that they use panels that are too small to allow them to draw firm conclusions.
 
I never expect a non-technical reporter to get the technical stuff exactly right. And headlines are written to sell newspapers (or page views). But the popular phrase "I never trust the media" often means "they are deliberately lying to us", which is quite a different proposition.

I can understand why you would conflate the two, because most of the people who say "I don't trust the media" for political reasons tend IMHO to believe that the "left-wing media" is a cabal of people advancing an agenda.

I'm not saying that. I'm saying that people whose only qualification is a journalism degree, and not expertise in a subject area, are incapable of understanding the nuance and complexity of a subject--and basically every subject has nuance and complexity just under the surface.

As I said, I'm in data storage. I work for a company that builds/sells both HDDs and SSDs. I constantly see tech journalists predicting the demise of HDD and that SSDs will soon take over the market without understanding the economic limitations on increasing NAND output to meet worldwide data storage demands. Without NAND, you don't have SSDs. And NAND output doesn't easily scale. It's really not a difficult thing to understand, but tech reporters don't get it. They're either well-versed in tech (and not economics, business, etc), or they're J-school grads who are JUST savvy enough in tech to not get laughed out of a room.

I'm not saying that the media is deliberately lying to us. I'm saying that for any reasonably complex subject area, the typical journalist doesn't have the depth to reasonably know truth from fiction.
 
  • Like
Reactions: Kee
A different proposition, so what? The media does engage in deception and lying; "deliberate" is superfluous as a lie is deliberate by any definition.

I don't want to further derail this thread (someone could start a thread in the debate forum). I do agree my use of the word "deliberate" in said context was redundant.
 
Here is more data on the first 33 Brulosophy experiments. It includes the ones I posted earlier. I've added at the end of each data line a I if the experiment was significant to the 0.05 with respect to Type I errors and a II if it was significant to the 0.05 level with respect to Type II error assuming differentiability of 0.2.

Of these 33 experiments 12 (36%) were significant with respect to Type I error (the only type the experimenters considerd) meaning that the hypothesis that tasters could tell the difference could be confidently accepted. But another 6 (18%) were significant with Type II error. The investigators statements about these tests is exemplified by their comments with respect to the last test in the data table below:

...suggesting participants in this xBmt were unable to reliably distinguish a beer fermented with GY054 Vermont IPA yeast from one fermented with WY1318 London Ale III yeast.
That's not a suggestion. There is good reason to believe that the beers are indistinguishable.

The following information is being shared purely to appease the curious and should not be viewed as valid data given the failure to achieve significance.
The experiment did acheive significance at the 0.04 level. We can say, with confidence at that level, that no more than 20% of the population represented by the taste panel would be able to distinguish beers brewed with these two yeasts. We can also say with 0.002 confidence that no more than 30% can. But our confidence that no more than 10% can tell the difference zooms to 28%

In many cases it's clear that a simple increase in the panel size would have yielded statistical significance. It is a real pity that these guys went to all this work (there are pages of these things) without consulting a statistician. These experiments could have been a goldmine to those who wish to ignore the statistical aspects (take them for what they are, not what we want them to be) but also to those who want to understand what they really mean. Even so there is quite a bit of usable data to mine. IMO if these folks want to go forward they should immediately obtain the standard and refrain from the practices which flagrantly violate it such as presenting two of one type of beer and one of the other and serving the beers in different colored cups. They should also use the Table in the standard to pick panel size.

Does this "professional" brewer think these experiments are a load of BS? No though he does see problems with them.

Experiment ; Panelists ; No. Correct ; p Type I ; p Type II ; MLE Pd ; Z ; SD ; Lower Lim ; Upper Lim
Hochkurz ; 26 ; 7 ; 0.8150 ; 0.0118 ; 0.000 ; 1.645 ; 0.130 ; 0.000 ; 0.215 II
Roasted Part 3 ; 24 ; 10 ; 0.2538 ; 0.2446 ; 0.125 ; 1.645 ; 0.151 ; 0.000 ; 0.373
Hop Stand ; 22 ; 9 ; 0.2930 ; 0.2262 ; 0.114 ; 1.645 ; 0.157 ; 0.000 ; 0.372
Yeast Comparison ; 32 ; 15 ; 0.0777 ; 0.4407 ; 0.203 ; 1.645 ; 0.132 ; 0.000 ; 0.421
Water Chemistry ; 20 ; 8 ; 0.3385 ; 0.2065 ; 0.100 ; 1.645 ; 0.164 ; 0.000 ; 0.370
Hop Storage ; 16 ; 4 ; 0.8341 ; 0.0207 ; 0.000 ; 1.645 ; 0.162 ; 0.000 ; 0.267 II
Ferm. Temp Pt 8 ; 20 ; 8 ; 0.3385 ; 0.2065 ; 0.100 ; 1.645 ; 0.164 ; 0.000 ; 0.370
Loose vs. bagged ; 21 ; 12 ; 0.0212 ; 0.7717 ; 0.357 ; 1.645 ; 0.162 ; 0.091 ; 0.624 I
Traditonal vs. short ; 22 ; 13 ; 0.0116 ; 0.8301 ; 0.386 ; 1.645 ; 0.157 ; 0.128 ; 0.645 I
Post Ferm Ox Pt 2 ; 20 ; 9 ; 0.1905 ; 0.3566 ; 0.175 ; 1.645 ; 0.167 ; 0.000 ; 0.449
Dry Hop at Yeast Pitch ; 16 ; 6 ; 0.4531 ; 0.1624 ; 0.063 ; 1.645 ; 0.182 ; 0.000 ; 0.361
Flushing w/ CO2 ; 41 ; 15 ; 0.3849 ; 0.0725 ; 0.049 ; 1.645 ; 0.113 ; 0.000 ; 0.234
Boil Vigor ; 21 ; 11 ; 0.0557 ; 0.6215 ; 0.286 ; 1.645 ; 0.163 ; 0.017 ; 0.555
Butyric Acid ; 16 ; 9 ; 0.0500 ; 0.6984 ; 0.344 ; 1.645 ; 0.186 ; 0.038 ; 0.650 I
BIAB; Squeezing ; 27 ; 8 ; 0.7245 ; 0.0228 ; 0.000 ; 1.645 ; 0.132 ; 0.000 ; 0.217 II
Dry Hop Length ; 19 ; 3 ; 0.9760 ; 0.0010 ; 0.000 ; 1.645 ; 0.125 ; 0.000 ; 0.206 II
Fermentatopm Temp Pt 7 ; 22 ; 11 ; 0.0787 ; 0.5415 ; 0.250 ; 1.645 ; 0.160 ; 0.000 ; 0.513
Water Chemistry Pt. 8 ; 22 ; 8 ; 0.4599 ; 0.1178 ; 0.045 ; 1.645 ; 0.154 ; 0.000 ; 0.298
The Impact Appearace Has ; 15 ; 7 ; 0.2030 ; 0.4006 ; 0.200 ; 1.645 ; 0.193 ; 0.000 ; 0.518
Stainless vs Plastic ; 20 ; 6 ; 0.7028 ; 0.0406 ; 0.000 ; 1.645 ; 0.154 ; 0.000 ; 0.253 II
Yeast US-05 vs. K-97 ; 21 ; 15 ; 0.0004 ; 0.9806 ; 0.571 ; 1.645 ; 0.148 ; 0.328 ; 0.815 I
LODO ; 38 ; 25 ; 0.0000 ; 0.9863 ; 0.487 ; 1.645 ; 0.115 ; 0.297 ; 0.677 I
Yeast WLP001 vs. US-05 ; 23 ; 15 ; 0.0017 ; 0.9424 ; 0.478 ; 1.645 ; 0.149 ; 0.233 ; 0.723 I
Whirlfloc ; 19 ; 9 ; 0.1462 ; 0.4354 ; 0.211 ; 1.645 ; 0.172 ; 0.000 ; 0.493
Yeast: Wyeast 1318 vs 1056 ; 21 ; 12 ; 0.0212 ; 0.7717 ; 0.357 ; 1.645 ; 0.162 ; 0.091 ; 0.624 I
Headspace ; 20 ; 11 ; 0.0376 ; 0.7002 ; 0.325 ; 1.645 ; 0.167 ; 0.051 ; 0.599 I
Yeast US-05 vs. 34/70 ; 34 ; 25 ; 0.0000 ; 0.9986 ; 0.603 ; 1.645 ; 0.113 ; 0.416 ; 0.790 I
Hops: Galaxy vs. Mozaic ; 38 ; 17 ; 0.0954 ; 0.3456 ; 0.171 ; 1.645 ; 0.121 ; 0.000 ; 0.370
Storage Temperature ; 20 ; 12 ; 0.0130 ; 0.8342 ; 0.400 ; 1.645 ; 0.164 ; 0.130 ; 0.670 I
Yeast Pitch Temp Pt. 2 ; 20 ; 15 ; 0.0002 ; 0.9903 ; 0.625 ; 1.645 ; 0.145 ; 0.386 ; 0.864 I
Corny vs. Glass Fermenter ; 29 ; 16 ; 0.0126 ; 0.7682 ; 0.328 ; 1.645 ; 0.139 ; 0.100 ; 0.555 I
Brudragon: 1308 vs GY054 ; 75 ; 28 ; 0.2675 ; 0.0405 ; 0.060 ; 1.645 ; 0.084 ; 0.000 ; 0.198 II
 
In many cases it's clear that a simple increase in the panel size would have yielded statistical significance.

<sigh>

This is true only if the proportions stayed the same or increased--which they may or may not do. It's entirely possible that larger sample sizes yield the same or even less significant results.

You cannot hold the proportions constant, assume an increase in sample size, and conclude that a larger sample size would have resulted in significance. It might well have resulted in the opposite. AJ, you want to argue the value of random guessing but then when it comes to this, you don't want randomness--you just want an increase in "n" without the attendant randomness in results.

The whole point of the formulas is that they already control for sample size. It's seen clearly in this formula:

zformula.png

The "n" in the formula is sample size. P-hat is the sample proportion, P is the proportion from the null, and Q is 1-P.

As "n" increases any particular result is more likely to be significant. But this presumes that there are no changes to the results which, under the null hypothesis, there quite possibly could be. That's what randomness does.
 
This is true only if the proportions stayed the same or increased--which they may or may not do. It's entirely possible that larger sample sizes yield the same or even less significant results.

But not probable. Here's how it works. Suppose we have a panel whose members can differentiate with probability Pd = 0.2 i.e. the signal is not very strong. With Pd = 0.2 in a triangle test the probability of a correct guess is Pc = Pd(1 - 1/3) + 1/3 = 0.4667. The fraction of observed correct guesses by a panel of M members is a binomially distributed RANDOM VARIABLE with mean Pc and standard deviation Sqrt(Pc*(1-Pc)/M). In the test we examine what the percentage of correct guesses tells us about the probability the null hypothesis is true. Under the null hypothesis (Pd = 0); Pc = 1/3 and the distribution of the fraction of correct hits is a binomial RANDOM VARIABLE with mean 1/3 and standard deviation sqrt(2/(9*M)).

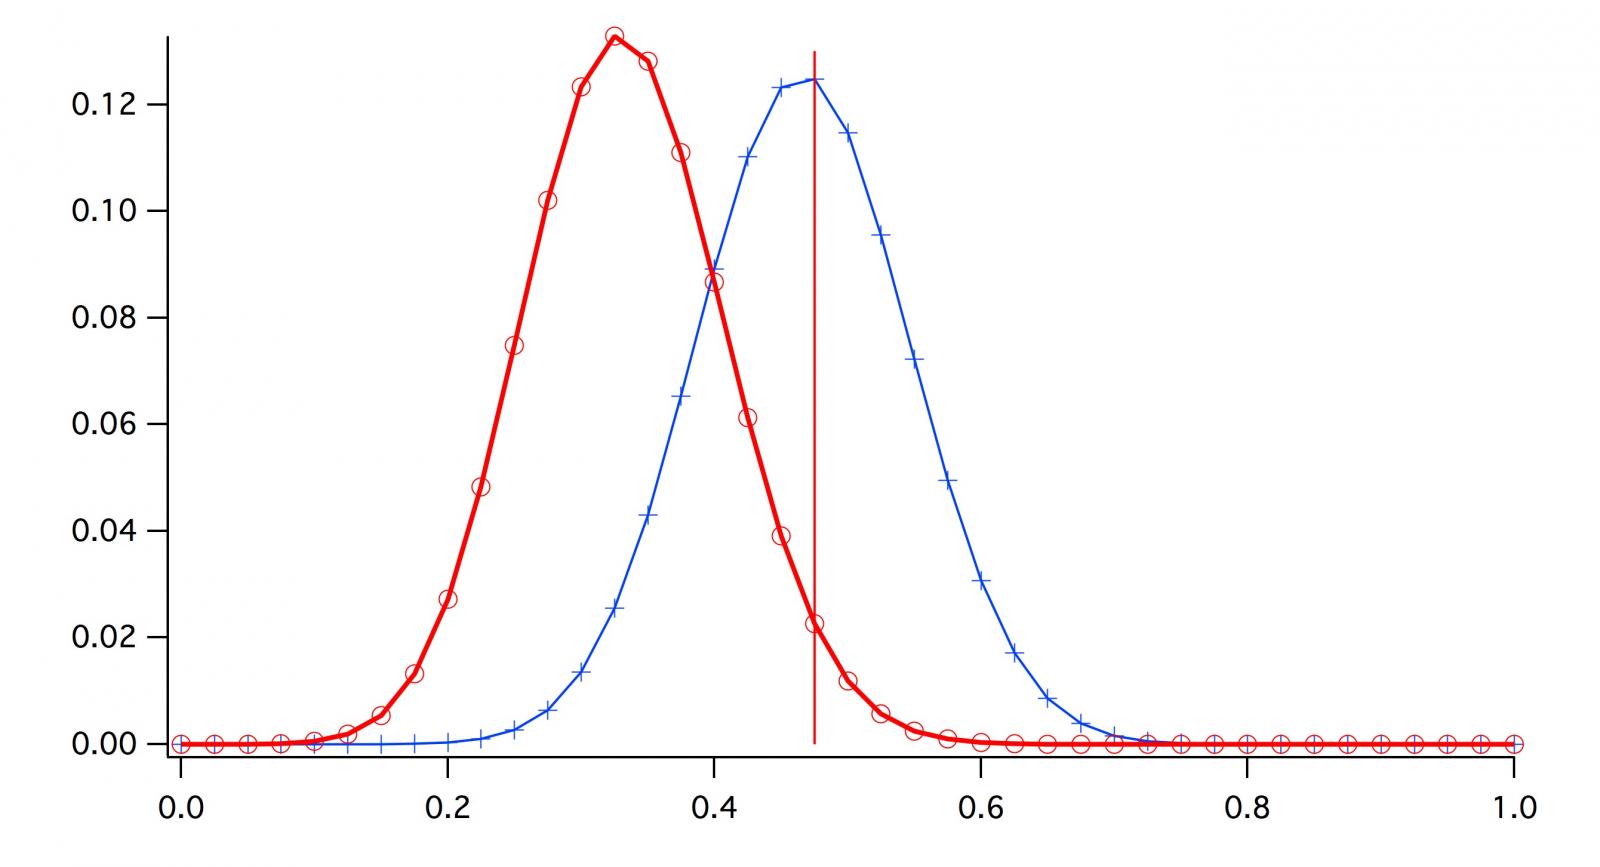
For M = 40 the distribution under the null hypothesis is given by the red 'curve' in the figure below. The binomial distribution is discrete and the circles show (on the vertical axis, the probability masses associated with each possible discrete value for Pc (the faction of correct answers). For a particular observed correct answers the significance (probability that the data can be explained by the null hypothesis) is the sum of the masses on the red curve to the right of, and including, the mass corresponding to N/M (N is the number of correct guesses and N/M is the estimate of Pc).

The blue curve represents the distribution of correct guesses for M=40 under the hypothesis that Pd = 0.2. The two curves overlap quite a bit. The probability of a correct guess result that lies well to the left of where it needs to for a desirable significance level is quite high. The vertical line connects the most likely fraction of observed correct guesses. It doesn't lie very far out on the tails of the null hypothesis distribution. About half the mass of the blue 'curve' lies to the left of that line and little out on the tail of the red curve. It is apparent that the probability of attaining good significance with M = 40 is small at this signal level.

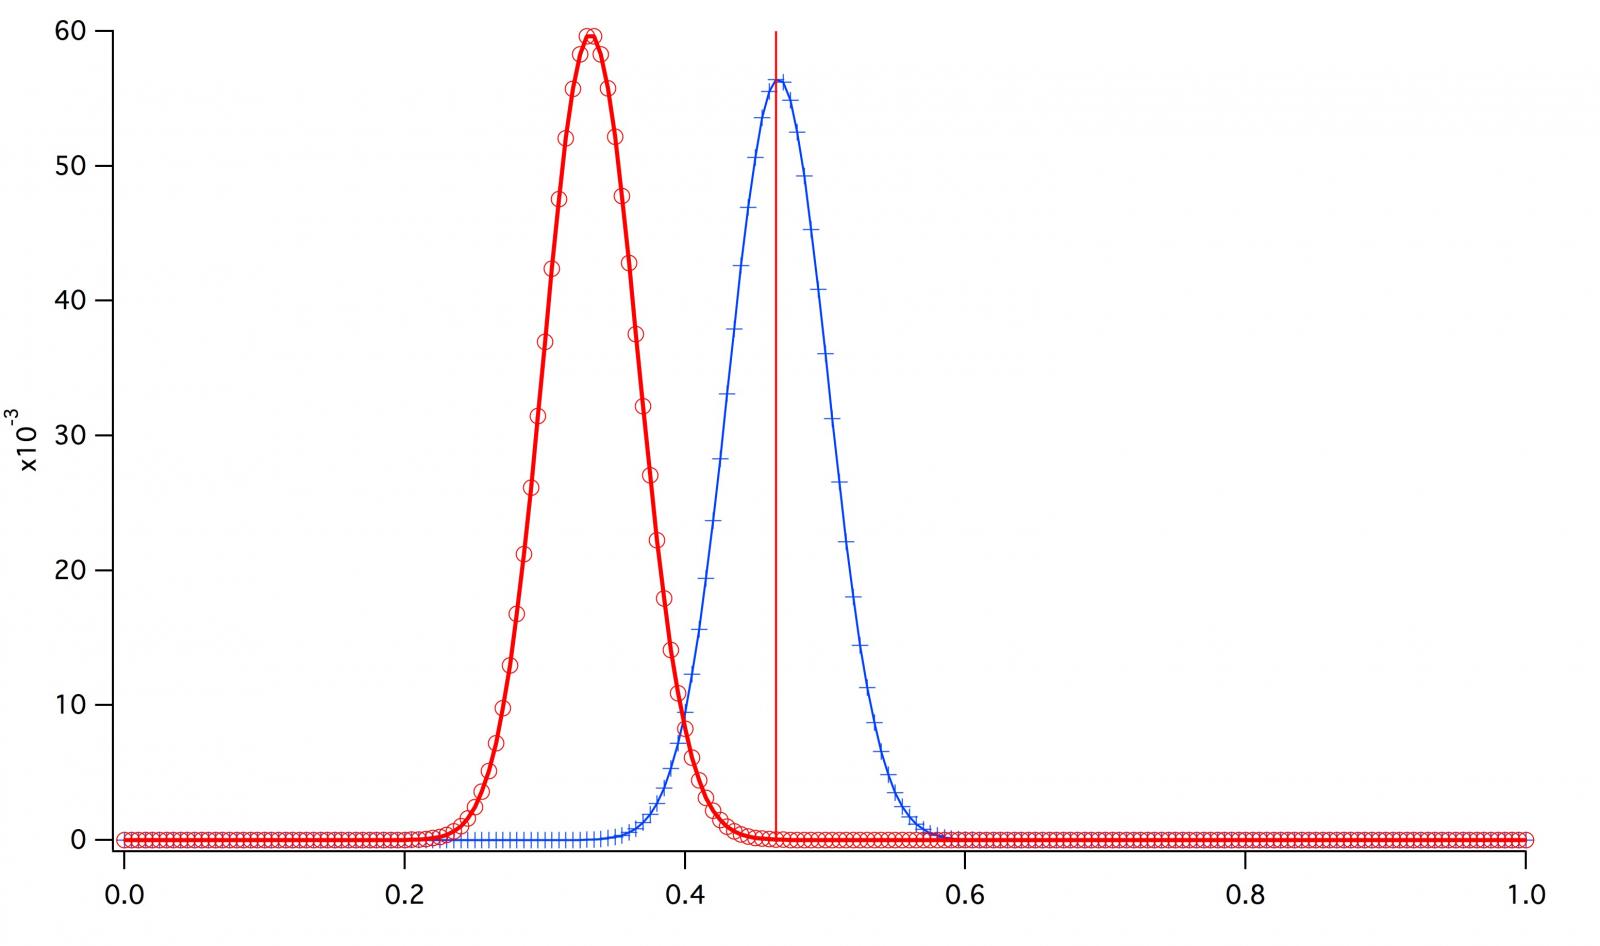
Now compare to the lower curves which are for M=200. Now I know perfectly well that M = 200 isn't a practical panel size but I chose it to make things very clear. Both distributions have narrowed (by a factor of sqrt(200/40) but their means have not changed. There is, thus, much less overlap. The most likely fraction of observed correct answers is now further out on the tails of the red curve as is the bulk of the blue curve mass. If we simply quintuple the panel size is there a guarantee that the fraction of correct answers will be the same? No but there is an awfully good chance that it will be within 2*Sqrt(Pc*(1-Pc)/N) which equals ±0.07 for M = 200 and ± 0.16 for M = 40.

A little surprised you didn't know about this.

You cannot hold the proportions constant,
I wouldn't do that.

...assume an increase in sample size, and conclude that a larger sample size would have resulted in significance. It might well have resulted in the opposite.
It can result in the opposite but as the curves show it is not probable that it will do so. On average, at least, it should be clear that increasing sample size increases the sensitivity of the test.

Are you familiar with the SEM (standard error in the mean)? If we take a series of measurements and average them the result is a random variable with mean given by the average and standard deviation given by the sample variance divided by the number of measurements - this is the SEM. Just as is the case here if we find the SEM too large we increase the number of measurements. Does this always guarantee improved accuracy? No, but it does most of the time.

AJ, you want to argue the value of random guessing
I think we have solidly established the value of guessing in a discrimination test - not much left to argue.

..but then when it comes to this, you don't want randomness--you just want an increase in "n" without the attendant randomness in results.
No, I don't want randomness but I haven't much choice as we are dealing with non deterministic events here. What I can do is reduce the randomness by increasing the sample size. Are you familiar with the concept of entropy? Statisticians, physicists, communications engineers etc. use it to measure disorder i.e. randomness. Since these binomials are pretty close to Gaussians I think we can use the entropy for the gaussian distribution. It is H = 0.5*ln(2*pi*variance). When I reduce the variance Pc*(1-Pc)/N I reduce the entropy.


The whole point of the formulas is that they already control for sample size. It's seen clearly in this formula:
The formula says that the critical value increases as N increases which means you are farther out on the tail of the null hypothesis distribution with resulting better (smaller) confidence. What you are ignoring is that as N increases the width of the distribution of the correct answers fraction also narrows meaning that one is, with high probability, out on the tail further still.

Binom40.jpg


Binom200.jpg
 
For "fun" -- and completely independent of AJ's efforts seen above, I can assure you -- I too spent many hours today reviewing every xbmt again in some detail, with my goal to determine whether panel size was sufficiently large in each xbmt in accordance with the ASTM Table A1.1, with inputs of alpha and beta = 0.20 and pD = 30%. All of these inputs are quite "generous" in my opinion. They basically mean that in order to achieve just 80% confidence (p<0.20) -- not even 95% (p<0.05) -- they really should require a minimum of 20 panelists. If they still insist on trying to achieve 95% confidence (p<0.05), then they really should require at least 40 panelists, otherwise it's just not meeting sensitivity requirements. We don't see 40+ panelists too often. But just shooting for 20 panelists, yeah, they're meeting that minimum most of the time these days... albeit usually they're just barely there right at 20, 21, 22, or 23, and like I've been saying for a loooong time, should only be reporting significance for p<0.20, not p<0.05. Perhaps it's just not very feasible to try to find more panelists for every xbmt, but it sure would be "nice" if they could. Humble thought to ponder. On the other hand, there were only a couple small handfuls of xbmts where they were grossly fewer than the ASTM standard minimum of 20 panelists, so that's cool. Far better than I originally thought actually. The vast majority have hit 20+ panelists which is great.

This is all the more reason why I personally won't bother to run any more semi-formal experiments. For my one where I kind of tried to emulate Brulosophy, I ended up with just 16 panelists, and the results just didn't seem right to me either, I think due to my own ****tiness as a homebrewer. My local club only has like 20 members, so even if I could come up with a decent set of beers to taste, I'm pretty much guaranteed to never reach the minimum number of panelists just shooting for 80% confidence, much less 95%. All my experiments would get to is "maybe kinda sorta there *might* be something going on here, on a good day, maybe". That's my interpretation of 80% confidence, and I couldn't even get there. Probably would have to say only 70% confidence, which is pretty dang weak!

The xbmts at B.com have been a little better than that -- a little. They're a lot of fun to talk about and think about and play around with, but truly (and they'll tell us the same thing themselves), they're also not anything to go jumping to any concrete conclusions from. Could be a launching point for further experiments, which is great if that's the real intent. I know that much is being achieved. People are getting very interested in running their own experiments, which is fantastic.

For what it is, it's cool. Could be better. But it's cool. I do appreciate very much all they've done and are doing. It's more data points, no matter how we might scrutinize it or how insignificant. It's still data, worth a little bit of thought. Not a lot. I know I'm going overboard analyzing things, but that's me, that's what I do, and I'm okay with it. :D

A couple of their truly most significant findings that I think are real and confirmed by multiple sources:

Beer geeks just cannot seem to discern differences in lagers where the primary fermentation was executed warm all the way up to friggin 72 F. This has been seen multiple times with multiple strains, so much that I myself am now trying this on two lagers with two different strains to see what happens. I should know more in a couple more weeks.

Excerpt from my spreadsheet: "a really ****ty LHBS crush adversely affects efficiency AND flavor". This was my own conclusion, right wrong or indifferent, based on my read of the 11/23/15 xbmt on the effect of crush. I'll have to run some more experiments in this regard, as my last couple experiments related to this (yes I've already run not one but two, and BOTH) got screwed up by yours truly. Like I said, I really shouldn't be the one to run any experiments on my own! But also I just can't help myself either. :)

Enough babbling from me again. Cheers all and good night.
 
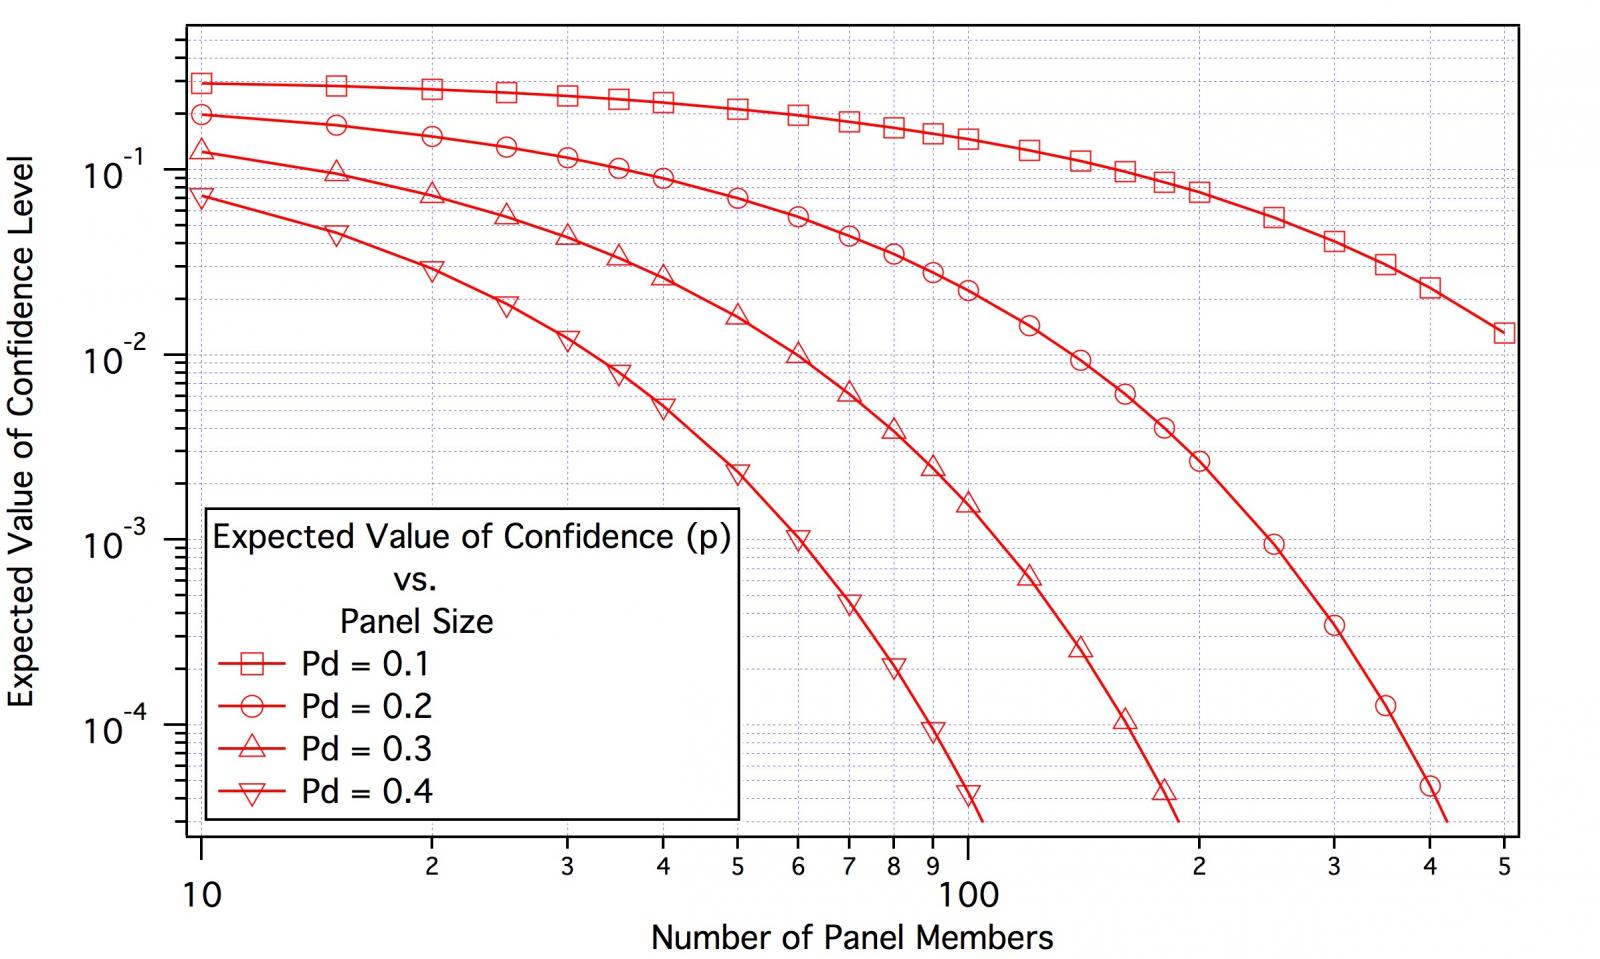
I cooked up the attached chart mostly to help mongoose understand what happens as we increase panel size but it should be valuable to anyone, including Brulosopher, in sizing panels. It shows the expected value of the confidence level (p) as a function of the signal strength (differentiability, Pd) and panel size. Now these are expected values (averages) and the distribution of p does have a variance associated with it so keep in mind that choosing a panel size from these curves only tells you that the average experimenter will get the indicated confidence level while some experimenters will get a better confidence and some worse. The obvious thing to do to insure the desired result is take what the curves show and add a pad.

The expected confidence level is strongly dependent on differentiability. No surprise there! As one usually doesn't know that at the outset that makes the curves difficult to use. In casual tasting of the two beers one should get some idea as to where Pd lies. If the investigator can't quite make up his mind whether he can tell there is a difference in casual tasting it is clear that Pd is small and he is going to need a large panel. OTOH if the difference really hits him in the face then it is clear the Pd is larger and a smaller panel can be used.

BinomialsExp.jpg
 
Well, there was one way that I've now made brulosophy "actionable".

I brewed a pilsner yesterday and my recipe called for 4% AA Saaz. When I got to the LHBS, they only had 2.2% Saaz, so I bought about double what I originally planned. So I read this:

http://brulosophy.com/2016/07/18/bittering-hops-pt-2-high-vs-low-alpha-acid-exbeeriment-results/

And saved myself another trip to the brewstore to get a different bittering hop like Magnum. And I used 10 oz of bittering hops in an 11 gal batch.

Of course, now I have to figure out how to unclog my CFC. Where's the XBMT for that? :(
 
But not probable.

Again, <sigh>

AJ, you're trying to teach Grandpa how to suck eggs. I already know that you don't really understand this stuff, and that was evident earlier in your misunderstanding of reliability and validity, and now in your statement that a result would be significant if a larger panel were used. That's a game, set, match type of comment.

And you present all kinds of handwaving to try to buttress....some sort of point. Not sure. You're not correct, and so even if what you post *is* correct, it isn't a defense of what you wrote.

It isn't.

I teach this material. I know it very, very well. You are a journeyman when it comes to this. If this were a water thread, I'd bow to your knowledge, which appears to be very good.

But this is not a water thread. Your attempt to deflect explanation of the misunderstanding is analogous to what I see people do in some fields, where if an analysis doesn't yield significance at the .05 level, they relax it to the .10 level. In other words, we're going to show something matters even if we have to change the rules to make it so. I always laugh at that, and whenever I see it, I know what they know about statistics--not much.

You can keep posting charts and graphs until you're blue in the face, but that changes nothing--it just makes it appear, to the casual reader, that you in fact have an argument, when you do not.

None of this makes you a bad person, but in this area, you might find it advantageous to listen more and post less.
 
Status
Not open for further replies.
Back
Top