When Thadius and company came out with their RaspberryPints project I immediately grabbed up all the recommended parts, put my system together and got my taplist displayed above my keezer and accessible via my intranet or even the internet.
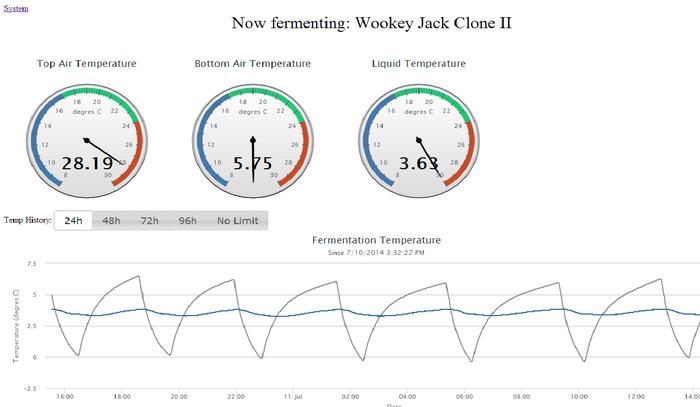
But what I have really been wanting for some time was a networked temperature logger that could drive a web page without needing to use an external service to access the information. There really isn't anything out there that does this well - if at all - aside from "home brewed" solutions.
Which brings me to this little project.
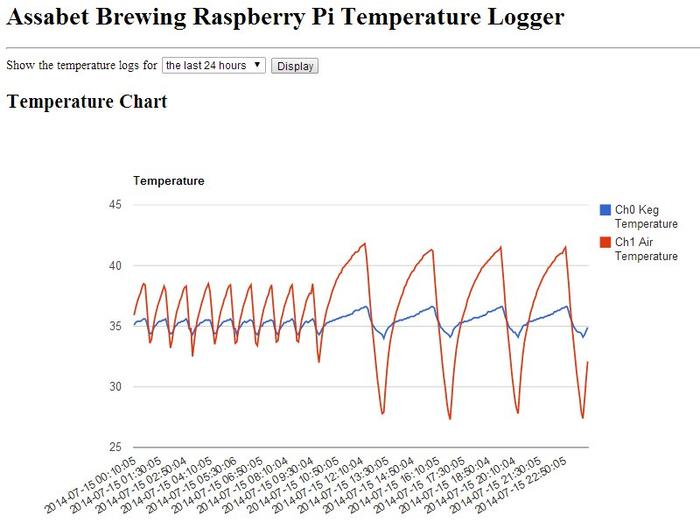
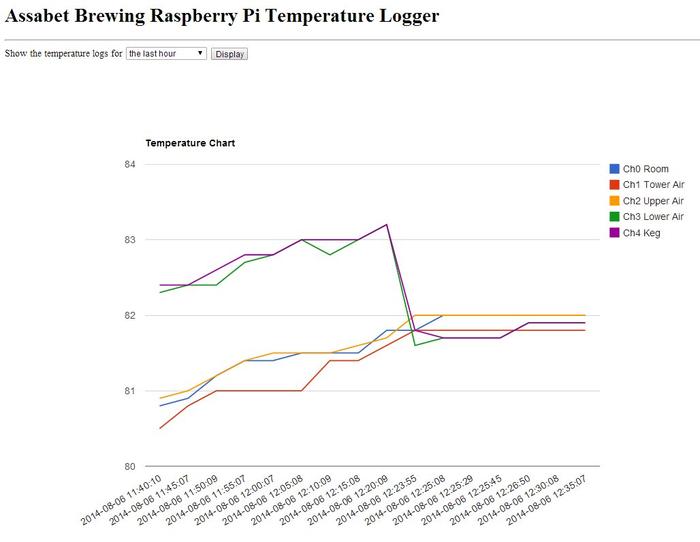
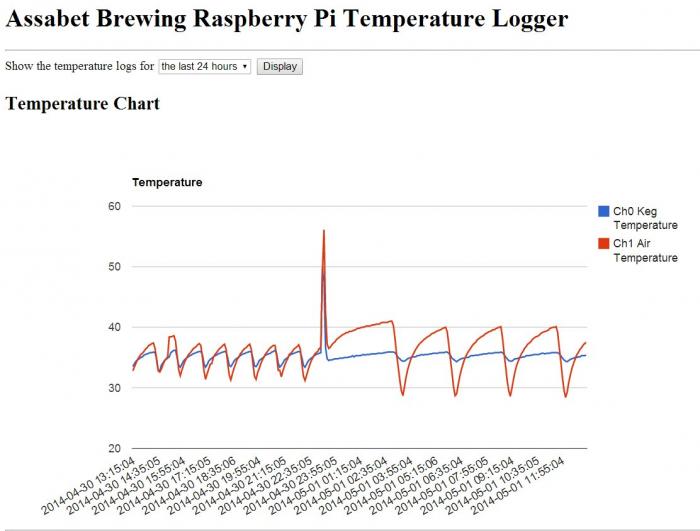
By implementing the RaspberryPints kit I had nearly everything I needed to cobble together a solution for remotely monitoring system temperatures in my little brewery. Starting with my keezer and adding a pair of DS18B20 "One Wire" digital temperature probes I can now monitor my keezer air temperature and the temperature of the "fullest" keg therein as measured by a probe in contact with the middle of the keg exterior, insulated with a 1" thick piece of closed cell foam roughly 4" on a side. I intend to add at least two more probes which will monitor my fermentation fridge and my cold conditioning/carbonation fridge.
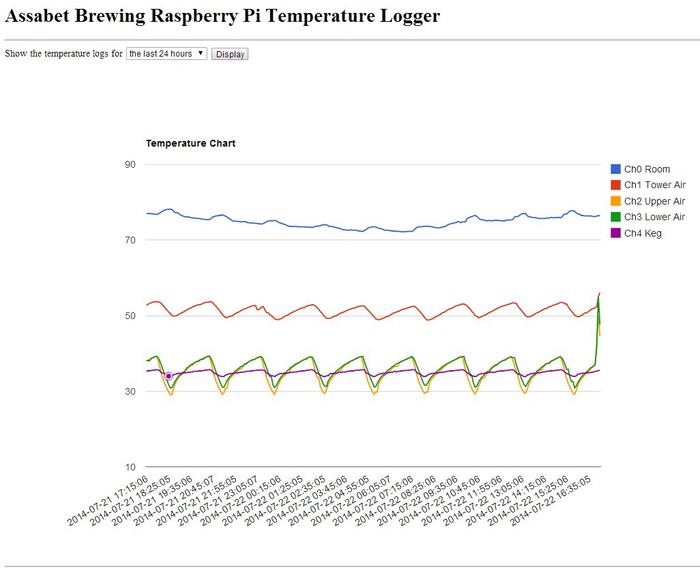
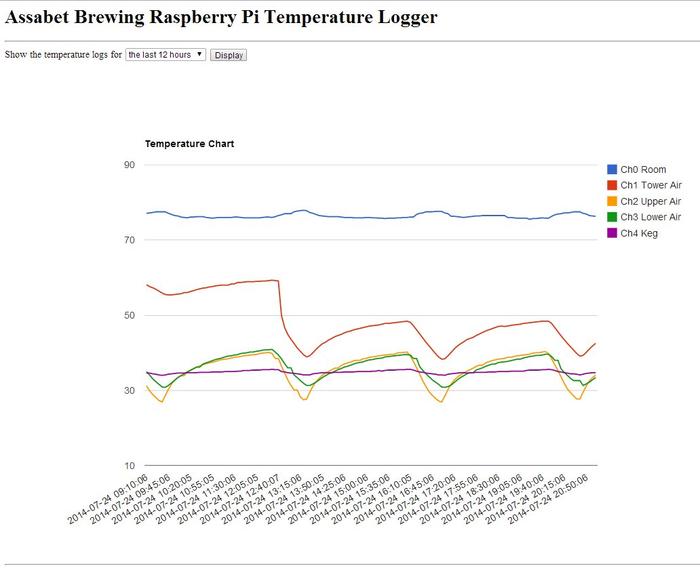
I linked the temperature log page to my RaspberryPints taplist via the hotspot temperature icon at the top-right corner for easy access. The interactive graph is generated by a Google service using Javascript, then the page is served by my 'Pi. The user can display a plot of temperatures over the last hour, 6 hours, 12 hours, 24 hours, and a full week.
With that intro out of the way...I've put together an archive file with the files needed to implement one and two channel temperature loggers, along with instructions and a few images for orientation when wiring the sensors to the 'Pi. I pretty much assume the user has the 'Pi for RaspberryPints service and is looking to expand its utility - hence certain prerequisite packages are also assumed to have been installed (eg: Raspbian OS with LXDE, Apache2, Chromium browser) and aren't dealt with at length.
I think the procedure is solid - I actually walked through the installation twice and let the results run for over a day (and still have both versions running) - but then again, that was on my 'Pi - which I've been thrashing pretty thoroughly - so there's always the possibly there's an undocumented step that will have to be exposed on a "virgin" 'Pi.
The archive file is located on my Google Drive share here. It contains:
2x13_header.jpg RPi' GPIO header diagram
ds18b20.jpg picture of a typical wired DS18B20 probe with wire colors
GPIO_header.jpg Another diagram of the RPi' GPIO header
monitor_1sensor.py logging script for 1 probe system
monitor_2sensors.py logging script for 2 probe system
pint.ico RaspberryPints icon for shortcuts
temp_logger_instructions.txt
test_sensors.py detect and test script for up to five probes
thermometer.png icon image for RaspberryPints integration
thermometer4k.png icon image for RaspberryPints integration HD
webgui1.py web page driver script for one sensor system
webgui2.py web page driver script for two sensor system
The rest is covered in the instructions which follow. The first user will receive mega golf claps for any debugging feedback received
Cheers!
==========================================================
RaspberryPi Web Accessible Temperature Logger
This kit will install support to read one or two DS18B20 "OneWire" temperature sensors, log the reading(s) to a database with a timestamp, and fetch entries from that database to drive a web page with a temperature chart and statistics.
Assumptions:
- Raspbian (Debian "Wheezy") OS, Apache2 web server, Chromium or compatible web browser already installed.
- user (default = pi) with superuser access
Components needed:
- one or two wired DS18B20 sensors
- 4.7K ohm axial lead resistor, preferably 1/8W
- hookup wires
Overview: Connect sensors, unpack archive files and move to require folders, set ownership & permissions for files, enable OneWire GPIO support, test the sensor(s), install SQLITE3, create the database, move database to require folder, set ownership & permission for database, create a CRON job to run the sensor polling code, and test the result.
1. Shut down, remove power, video cable, network cable, SD card, USB devices, etc, and open case (if used).
2. Wire up DS18B20 sensor(s):
Sensor red wire(s) to +3.3V (GPIO header pin 1 or 17)
Sensor black wire(s) to GND (GPIO header pin 6,9,14,20 or 25)
Sensor yellow (or white) wire(s) to GPIO4 (GPIO header pin 7)
Add a 4.7K ohm 1/8w resistor across GPIO header pins 1 and 7 (ie: between red and yellow/white wires).
3. Reconnect all cables and devices. Power up, then download and unpack the archive into /home/pi, then:
Move files to /usr/lib/cgi-bin : monitor_1sensor.py, monitor_2sensors.py, pint.ico, webgui1.py, webgui2.py (SEE NOTE)
Move files to /var/www/img: thermometer.png, thermometer4k.png
Leave files in /home/pi : test_sensors.py, 2x13_header.jpg, ds18b20.jpg, GPIO_header.jpg, temp_logger.txt
NOTE: You only need the files for the number of sensors installed. You can delete the extras.
4. Change ownership and permissions on monitor scripts:
$ sudo chown www-data:www-data /usr/lib/cgi-bin/monitor_1sensor.py (or monitor_2sensors.py)
$ sudo chmod +x /usr/lib/cgi-bin/monitor_1sensor.py (or monitor_2sensors.py)
5. Change ownership and permissions on web server scripts:
$ sudo chown www-data:www-data /usr/lib/cgi-bin/webgui1.py (or webgui2.py)
$ sudo chmod +x /usr/lib/cgi-bin/webgui1.py (or webgui2.py)
6. Enable w1 bus support: Edit file /etc/modules
$ sudo nano /etc/modules
w1-gpio <- add this line
w1-therm <- and this line
^o to save the file
^x to exit nano
7. Reboot the RPi
8. Test temperature sensors: (do this in /home/pi)
$ python test_sensors.py
Up to five sensors can be detected and interrogated by this program.
If no sensors are found, shut down and check wiring.
If sensors are detected, they will be listed in order of their device addresses (each device has a unique hard-coded address).
The logging program will always use the sensors in numeric order (first = channel 0, second = channel 1).
If using multiple sensors, use this program to determine which is which by observing which sensor changes temperature while being warmed in the hand.
Label each sensor with its channel number.
9. Install SQLITE3:
$ sudo apt-get update
$ sudo apt-get install sqlite3
10. Create SQLITE3 temperature database: (do this in /home/pi)
For one channel:
$ sqlite3 temp_data.db
BEGIN;
CREATE TABLE temps (timestamp DATETIME, temp0 NUMERIC);
COMMIT;
.quit
For two channels:
$ sqlite3 temp_data2.db
BEGIN;
CREATE TABLE temps (timestamp DATETIME, temp0 NUMERIC, temp1 NUMERIC);
COMMIT;
.quit
11. Move database to /var/www, change ownership to www-data, and set permissions:
For one sensor:
$ sudo mv temp_data.db /var/www/
$ sudo chown www-data:www-data /var/www/temp_data.db
$ sudo chmod +x /var/www/temp_data.db
For two sensors:
$ sudo mv temp_data2.db /var/www/
$ sudo chown www-data:www-data /var/www/temp_data2.db
$ sudo chmod +x /var/www/temp_data2.db
12. Create cron job for temperature monitor python script
NOTE: the leading '*/5' sets the period to 5 minutes. Adjust as desired.
Only one of the entry lines is required to be added.
$ sudo crontab -u www-data -e
*/5 * * * * /usr/lib/cgi-bin/monitor_1sensor.py <- add this line near bottom for one sensor, OR
*/5 * * * * /usr/lib/cgi-bin/monitor_2sensors.py <- add this line near bottom for two sensors
^o to save the file
^x to exit
At this point the python monitor script should run every 5 minutes, read the sensor(s), and post the data to the database temp_data.db (for one sensor operation) or temp_data2.db (for two sensor operation). All that remains is running the web server python script from a browser to access the database and format and display the resulting web page.
13. Launch Chromium on the RaspberryPi and enter the url for your RPi, followed by the file name for the webgui version used (ie: webgui1.py or webgui2.py). You can use the localhost address as a test.
Eg: http://127.0.0.1/cgi-bin/webgui1.py or http://127.0.0.1/cgi-bin/webgui2.py
Replace 127.0.0.1 with LAN IP address to access web page from a web browser on another system on your LAN.
To access the web page from a system external to your LAN you'll need to determine the external IP address for your network and establish port-forwarding rules through any routers between the public internet and your LAN.
Extra:
Integration with RaspberryPints:
You can replace the RaspberryPints icon with the thermometer icons provided with this kit, and change the http hotspot link to point to the temperature logger page.
Edit the file /var/www/index.php
$ sudo nano /var/www/index.php
Find the .png file tags:
^W (where is) then enter .png and hit Enter
The cursor will move to the first instance.
We will change the http url and the filename
Replace "http://www.raspberrypints.com" with the url of your RPi server
Replace "raspberrypints-4k" with "thermometer4k"
Two lines below is the other instance.
Replace "http://www.raspberrypints.com" with the url of your RPi server
Replace "raspberrypints" with "thermometer".
^o to save the file
^x to exit nano
Examples:
<a href="http://96.252.83.5:84/cgi-bin/webgui2.py"><img src="img/thermometer4k.png" height="200" alt=""></a>
<a href="http://96.252.83.5:84/cgi-bin/webgui2.py"><img src="img/thermometer.png" height="100" alt=""></a>
[Note: for now, at least, those two urls will access my 'Pi]
Now, when you load your RaspberryPints taplist, there should be a thermometer icon in the top right corner than when clicked will load your temperature logger page.
================================================================================================================
Credits!
Totally facilitated by Steve Breuning's work found here: http://raspberrywebserver.com/cgiscripting/rpi-temperature-logger/
I merely expanded the database for multiple probes and tweaked some database, python and html code. I'd be at Square One without his precedent.
And, of course, fellow HBTer Thadius856 and his RaspberryPints crew for not only the Digital Tap List effort but for the inspiration to get off my ass and build what I couldn't buy.
Cheers!
/Dave T. (aka day_trippr)










![Craft A Brew - Safale S-04 Dry Yeast - Fermentis - English Ale Dry Yeast - For English and American Ales and Hard Apple Ciders - Ingredients for Home Brewing - Beer Making Supplies - [1 Pack]](https://m.media-amazon.com/images/I/41fVGNh6JfL._SL500_.jpg)









 In which file do you put this info in?
 If you have the Pi, might as well find more uses for it.