Damn that sucks. How'd the carboy break?Yep, it sure did drop like that in SG. Incidentally, I broke the carboy (in 12 freaking years of brewing, never broke one before) last night which left a nice hole in the top. Crazy break really!
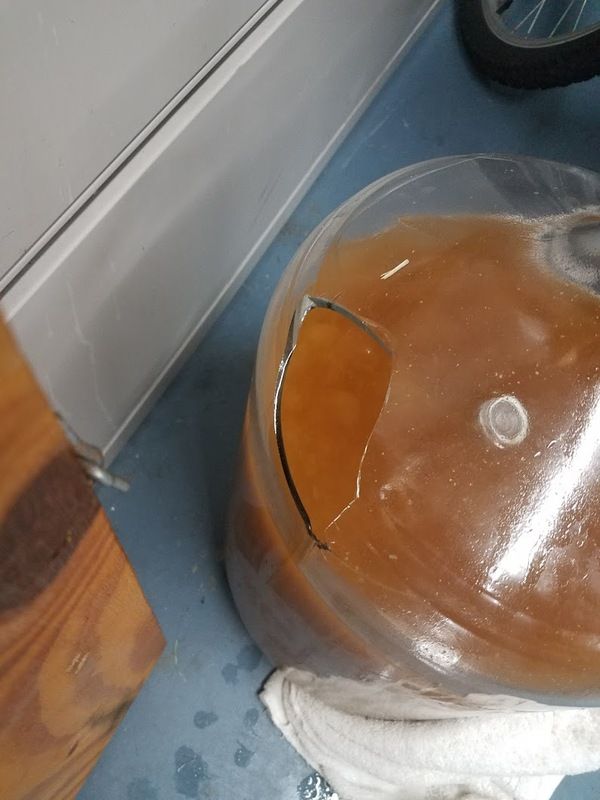
Anyway, since it ruined the batch and had never done a gose before, I took a sample and a taste. Sample was at 65F and read right at 1.018, which shows the Tilt was right on target. It was sad to dump the beer, it was pretty tasty honestly, but that glass from the outside was now on the inside and I didn't want to take a chance contaminating the beer with something nasty that was lurking on the outside of the carboy. I ALMOST grabbed a keg and said screw it but decided against it.
The temp cycling up and down is from the fermentation chamber. It's set to 65 and it kicks on when it hits 66 and off at 64. I have a temp probe in a thermowell in the brew controlling the fermentation chamber. The Tilt just saves the data for me.
You are using an out of date browser. It may not display this or other websites correctly.
You should upgrade or use an alternative browser.
You should upgrade or use an alternative browser.
Tilt Hydrometer
- Thread starter JoeTrott
- Start date

Help Support Homebrew Talk:
This site may earn a commission from merchant affiliate
links, including eBay, Amazon, and others.

- Joined
- Dec 5, 2007
- Messages
- 1,719
- Reaction score
- 759
Those are some oddly consistent temperature fluctuations between 64 and 66 degrees.Used mine for the first time on Saturday to check in on the gose I brewed. Have an old cell phone logging data and uploading to Google Sheets. Pretty cool device.
View attachment 590775
Stinks about the carboy.
Those are some oddly consistent temperature fluctuations between 64 and 66 degrees.
That's what solid construction will give you!

It's not THAT consistent but yeah, it's pretty steady and I'm pretty happy about that! Isn't that the primary objective? Here's a shot of my fermentation chamber. It doubles as a workbench too. Love that thing.

I reused the pink insulation from my Son of A Fermentation Chiller build. Reduce, reuse, recycle!
Damn that sucks. How'd the carboy break?
So..... notice how the gravity kind of settled out? Well, yesterday after it sat at at the same SG for a day, I decided it intercede. I was giving the carboy a rousing and it tapped the other carboy. When I say tapped, I mean it just ever so slightly tapped. The spot where it cracked was the 'seam' where the sides joined each other and then the top. It was a one in a 1000 tap. I've had this thing for 12 years and have tapped it like this a few times before without a problem. I just got really unlucky this time. A real bummer.
I am really lucky I didn't bathe myself in beer and shards of glass!
ClearedHot
Member
Is the data stored on the Tilt device itself at all?
If a person wasn't interested in uploading the data to the cloud, could they just access the data intermittently by launching the Tilt app on a smart device when they wanted to, and have the full range of data upload from the tilt to the app?
Or is the data ONLY stored in the cloud, and doing what I've described would mean all you could see was the temperature and gravity at that one point in time?
You may have a few more options to log data from Tilt, some cloud-based and others on your network:
Tiltbridge + Fermentrack: A little soldering gets you a way to go from Tilt Bluetooth to WiFi and then to your RPi, app or whatever. The Fermentrack project can also do the data logging if you don't want to use the native Tilt app. I plan to give the Bridge solution a try, or Pi Zero at least.
Brewfather.app I hope this app is finally the Beersmith-killer I think it is. So completely fed up dealing with the ancient file & folder interface on Beersmith and came across this project the other day via Hoprod Garage on Instagram. I already love this app's recipe features and the fact that I can use it on any device is a big upside over Beersmith 3's locking you into two devices and paying extra for the app. That's all great but what's next level about it is they have BrewPiLess and Tilt support built in already. So, regardless of how you want to log - WiFi or Bluetooth on your phone - this app pulls it all into to your session data. Very comprehensive app walkthrough/review on YouTube.
As other's have said, Google Sheets is another solid option. Obvious benefits aside, if you still want super slick charts updated in real-time it's dead simple to use Google Data Studio to make it look like you coded your very own app. A quick search around the forums you will find a half-dozen other visualization tools that you can plug Sheets or other log files into.
Have done way too much research into this stuff lately. Hope it helps!


$7.79 ($7.79 / Count)
Craft A Brew - LalBrew Voss™ - Kveik Ale Yeast - For Craft Lagers - Ingredients for Home Brewing - Beer Making Supplies - (1 Pack)
Craft a Brew


$176.97
1pc Commercial Keg Manifold 2" Tri Clamp,Ball Lock Tapping Head,Pressure Gauge/Adjustable PRV for Kegging,Fermentation Control
hanhanbaihuoxiaoshoudian


$58.16
HUIZHUGS Brewing Equipment Keg Ball Lock Faucet 30cm Reinforced Silicone Hose Secondary Fermentation Homebrew Kegging Brewing Equipment
xiangshuizhenzhanglingfengshop


$22.00 ($623.23 / Ounce)
AMZLMPKNTW Ball Lock Sample Faucet 30cm Reinforced Silicone Hose Secondary Fermentation Homebrew Kegging joyful
无为中南商贸有限公司


$39.22 ($39.22 / Count)
Brewer's Best Home Brew Beer Ingredient Kit - 5 Gallon (Mexican Cerveza)
Amazon.com


$10.99 ($31.16 / Ounce)
Hornindal Kveik Yeast for Homebrewing - Mead, Cider, Wine, Beer - 10g Packet - Saccharomyces Cerevisiae - Sold by Shadowhive.com
Shadowhive


$27.29 ($13.64 / Count)
$41.99 ($21.00 / Count)
2 Pack 1 Gallon Large Fermentation Jars with 3 Airlocks and 2 SCREW Lids(100% Airtight Heavy Duty Lid w Silicone) - Wide Mouth Glass Jars w Scale Mark - Pickle Jars for Sauerkraut, Sourdough Starter
Qianfenie Direct


$33.95
Five Star - 6022b_ - Star San - 32 Ounce - High Foaming Sanitizer
Bridgeview Beer and Wine Supply


![Craft A Brew - Safale S-04 Dry Yeast - Fermentis - English Ale Dry Yeast - For English and American Ales and Hard Apple Ciders - Ingredients for Home Brewing - Beer Making Supplies - [1 Pack]](https://m.media-amazon.com/images/I/41fVGNh6JfL._SL500_.jpg)
$6.95 ($17.38 / Ounce)
$7.47 ($18.68 / Ounce)
Craft A Brew - Safale S-04 Dry Yeast - Fermentis - English Ale Dry Yeast - For English and American Ales and Hard Apple Ciders - Ingredients for Home Brewing - Beer Making Supplies - [1 Pack]
Hobby Homebrew


$53.24
1pc Hose Barb/MFL 1.5" Tri Clamp to Ball Lock Post Liquid Gas Homebrew Kegging Fermentation Parts Brewer Hardware SUS304(Liquid Hose Barb)
Guangshui Weilu You Trading Co., Ltd


$53.24
1pc Hose Barb/MFL 1.5" Tri Clamp to Ball Lock Post Liquid Gas Homebrew Kegging Fermentation Parts Brewer Hardware SUS304(Liquid Hose Barb)
yunchengshiyanhuqucuichendianzishangwuyouxiangongsi


$20.94
$29.99
The Brew Your Own Big Book of Clone Recipes: Featuring 300 Homebrew Recipes from Your Favorite Breweries
Amazon.com


- Joined
- Dec 5, 2007
- Messages
- 1,719
- Reaction score
- 759
You can use a raspberry pi--I bought a Zero W kit for ~$30 on amazon--and install the TiltPi image on it to connect to the Tilt. You only have to edit one setup file on the RPi's SD card so it will connect to your WIFI and then as soon as it detects a Tilt bluetooth signal you can set up logging through it's web interface. You can store log data on the RPi and also set up cloud based logging. I'm doing both right now.Is the data stored on the Tilt device itself at all?
If a person wasn't interested in uploading the data to the cloud, could they just access the data intermittently by launching the Tilt app on a smart device when they wanted to, and have the full range of data upload from the tilt to the app?
Or is the data ONLY stored in the cloud, and doing what I've described would mean all you could see was the temperature and gravity at that one point in time?
thejuanald
Well-Known Member
This seems awesome. What's the distance the Bluetooth will work on this? How far outside the fermentation chamber can I have my Raspberry Pi?
Last edited:
It depends on your house structure and where you have the Tilt. In a PET fermentor in my unfinished basement, I was able to read the Tilt on the second floor of my house, in the room at that end of house.
When it was in my stainless fermentor, I had to be 10-20 feet away, in the basement.
When it was in my stainless fermentor, I had to be 10-20 feet away, in the basement.
Last edited:
PeteSeattle
Well-Known Member
I found his to be very true. The water calculator on Brewfather is something worth checking out too.Brewfather.app I hope this app is finally the Beersmith-killer I think it is. So completely fed up dealing with the ancient file & folder interface on Beersmith and came across this project the other day via Hoprod Garage on Instagram. I already love this app's recipe features and the fact that I can use it on any device is a big upside over Beersmith 3's locking you into two devices and paying extra for the app. That's all great but what's next level about it is they have BrewPiLess and Tilt support built in already. So, regardless of how you want to log - WiFi or Bluetooth on your phone - this app pulls it all into to your session data. Very comprehensive app walkthrough/review on YouTube.
thejuanald
Well-Known Member
It depends on your house structure and where you have the Tilt. In a PET fermentor in my unfinished basement, I was able to read the Tilt on the second floor of my house, in the room at that end of house.
When it was in my stainless fermentor, I had to be 10-20 feet away, in the basement.
Wow that is some pretty great distance on the Bluetooth. I am definitely going to consider this.
CodeSection
Well-Known Member
- Joined
- Feb 4, 2018
- Messages
- 1,655
- Reaction score
- 819
You may have a few more options to log data from Tilt, some cloud-based and others on your network:
Tiltbridge + Fermentrack: A little soldering gets you a way to go from Tilt Bluetooth to WiFi and then to your RPi, app or whatever. The Fermentrack project can also do the data logging if you don't want to use the native Tilt app. I plan to give the Bridge solution a try, or Pi Zero at least.
Brewfather.app I hope this app is finally the Beersmith-killer I think it is. So completely fed up dealing with the ancient file & folder interface on Beersmith and came across this project the other day via Hoprod Garage on Instagram. I already love this app's recipe features and the fact that I can use it on any device is a big upside over Beersmith 3's locking you into two devices and paying extra for the app. That's all great but what's next level about it is they have BrewPiLess and Tilt support built in already. So, regardless of how you want to log - WiFi or Bluetooth on your phone - this app pulls it all into to your session data. Very comprehensive app walkthrough/review on YouTube.
As other's have said, Google Sheets is another solid option. Obvious benefits aside, if you still want super slick charts updated in real-time it's dead simple to use Google Data Studio to make it look like you coded your very own app. A quick search around the forums you will find a half-dozen other visualization tools that you can plug Sheets or other log files into.
Have done way too much research into this stuff lately. Hope it helps!
Funny, I could only get the BrewFather.app to load and work (settings could be changed, etc.) on my iPhone 8 but could not get it to work on my older iPad or Windows10 computer. Thus, I could not evaluate the program. Nothing could be added or changed on the iPad and the Windows10 computer.
ClearedHot
Member
Funny, I could only get the BrewFather.app to load and work (settings could be changed, etc.) on my iPhone 8 but could not get it to work on my older iPad or Windows10 computer.
Open https://brewfather.app/ in your desktop browser
Then, click the "Open APP" link in the top right corner
You will be prompted to create an account and login. Once you are logged in to your new account you should see a page like this.
If you get stuck, check out their Getting Started documentation: https://docs.brewfather.app/getting-started
in the main menu you will find 'Tools' where you calibrate your equipment and 'Settings' where you can change your units and connect up to BrewPiLess, iSpindel or Tilt
ClearedHot
Member
Another "feature" worth mentioning when you are setting up. Brewfather uses Open.App so the app isn't downloadable per se. It's a website you can save to your home screen on your phone and bookmark in your browser. I pin the tab in Chrome, for example. It's always up to date and you aren't getting a completely different version of the program when you switch devices.
As long as your Tilt is can access the internet and access the Brewfather log URL, it will send new readings every 15 min. Here are the setup: https://docs.brewfather.app/integrations/tilt-hydrometer
As long as your Tilt is can access the internet and access the Brewfather log URL, it will send new readings every 15 min. Here are the setup: https://docs.brewfather.app/integrations/tilt-hydrometer
CodeSection
Well-Known Member
- Joined
- Feb 4, 2018
- Messages
- 1,655
- Reaction score
- 819
Open https://brewfather.app/ in your desktop browser
Then, click the "Open APP" link in the top right corner
You will be prompted to create an account and login. Once you are logged in to your new account you should see a page like this.
If you get stuck, check out their Getting Started documentation: https://docs.brewfather.app/getting-started
in the main menu you will find 'Tools' where you calibrate your equipment and 'Settings' where you can change your units and connect up to BrewPiLess, iSpindel or Tilt
Thanks for trying to help. I probably should add, I already created an account and have not enter any new batch.
When I login, it appears to work on my iPhone 8. However, when I login on my older iPad and on my Windows 10 desktop, while I am able to log in, it will not work.
On those two devices, under the "batches" tab, I get the "blue loading circle" and nothing happens. When I try to go to settings to change the measurement scales, the item will blink and then not change. I am able to turn on the Tilt selection. Then when I exit "settings" and later go back to it, the Tilt selection is turned off. Nothing is saved.
Again, these problems only occur on my older iPad and Windows 10. Again, I am logged in.
ClearedHot
Member
Hi CodeSection,
There is definitely a server call on the Batches tabs so I can see where that might be an issue for some browsers.
I'm using Chrome on Win10 for the most part and no issues creating recipes or batches so far. It may be an issue with MS Edge and older versions of Safari implementing JS. Try it on IE 11 on Windows 10 (instead of Edge) and check to see that Javascript is enabled on Safari. If that doesn't work see if Chrome is available for your older iPad. That might do the trick.
If you can't get one or the other to work, let them know there's a bug out there: https://bitbucket.org/brewfather/brewfather/issues?status=new&status=open.
Edit: corrected link to the right bugtracker
Last edited:
CodeSection
Well-Known Member
- Joined
- Feb 4, 2018
- Messages
- 1,655
- Reaction score
- 819
Hi CodeSection,
There is definitely a server call on the Batches tabs so I can see where that might be an issue for some browsers.
I'm using Chrome on Win10 for the most part and no issues creating recipes or batches so far. It may be an issue with MS Edge and older versions of Safari implementing JS. Try it on IE 11 on Windows 10 (instead of Edge) and check to see that Javascript is enabled on Safari. If that doesn't work see if Chrome is available for your older iPad. That might do the trick.
If you can't get one or the other to work, let them know there's a bug out there: https://bitbucket.org/brewfather/brewfather/issues?status=new&status=open.
Edit: corrected link to the right bugtracker
Thanks CleareHot! It doesn't work on my iPad OS 9.3.5. You are probably correct about the Safari version. I just tried it with IE 11 browser and it works! Before, I was using the Firefox browser. I haven't tried Chrome or MS Edge as it is now working.
Again, thanks for the help!
Murphys_Law
Well-Known Member
Anyone have problems at the end of fermentation? The last few batches have shown “1.000” or “1.002”. I thought I was getting an infection or something but when I took a hydro it was near what I expected (eg 1.012).
It was pretty spot on at the start, though.
I shook the ferm vessel thinking there was dry hop debris, krausen, etc messing with the reading and it didn’t change.
It was pretty spot on at the start, though.
I shook the ferm vessel thinking there was dry hop debris, krausen, etc messing with the reading and it didn’t change.
- Joined
- Dec 5, 2007
- Messages
- 1,719
- Reaction score
- 759
My fermenter is a 10 cf chest freezer with a Speidel plastic fermenter in it and the RPi hangs about 3 feet above the freezer. I've never had a problem getting a bluetooth signal but I haven't tried to see how far away the RPi can be placed. I'm not sure how to interpret this but the RPi web interface says that the signal from my Tilt is usually between -83 and -90 dBm which I believe is pretty strong.This seems awesome. What's the distance the Bluetooth will work on this? How far outside the fermentation chamber can I have my Raspberry Pi?
Anyone know if when using the tilt and uploading to Google Sheets, can you also have it upload to brewstat.us simultaneously, or will it only upload to one or the other?
It's one or the other. Next the checkbox for logging to the web, you fill in what address to log to. I tried out both of them. Brewstat has a sexier look to it, but I didn't like that I had to export my recipes from BeerSmith to make an .xml in order for Brewstat to work, and I definitely didn't like not having all the data myself to review and store on my own drive. So I use the Google Sheets.
Yeah i tested it while waiting for a response and you're right - it's one or the other. I interrupted my sheet and had to start over. So i lost the first 6 points but that's okIt's one or the other. Next the checkbox for logging to the web, you fill in what address to log to. I tried out both of them. Brewstat has a sexier look to it, but I didn't like that I had to export my recipes from BeerSmith to make an .xml in order for Brewstat to work, and I definitely didn't like not having all the data myself to review and store on my own drive. So I use the Google Sheets.
ClearedHot
Member
So I use the Google Sheets.
If you want sexy charts from your Google Sheets, try designing a chart in Google Data Studio.
Basically, it will take whatever data you have in your sheet and plot it on a web page that updates whenever you refresh it.
It's super easy to setup and you can copy that template into a new report every time you start a new batch.
First batch currently fermenting with the Tilt, so awesome seeing it in action - particularly since I use the BrewJacket, which is fantastic, but means you can't really see what's going on...
I've been using Beersmith for a while, and am reasonably used to it - not necessarily looking specifically to replace it, but thought I'd take a look at Brewfather, since some people in this thread have recommended it - does anyone know how to set up a BIAB-based profile that includes adding top-up water?
I've been using Beersmith for a while, and am reasonably used to it - not necessarily looking specifically to replace it, but thought I'd take a look at Brewfather, since some people in this thread have recommended it - does anyone know how to set up a BIAB-based profile that includes adding top-up water?
Last edited:
First batch currently fermenting with the Tilt, so awesome seeing it in action - particularly since I use the BrewJacket, which is fantastic, but means you can't really see what's going on...
I've been using Beersmith for a while, and am reasonably used to it - not necessarily looking specifically to replace it, but thought I'd take a look at Brewfather, since some people in this thread have recommended it - does anyone know how to set up a BIAB-based profile that includes adding top-up water?
Why use top off water? Why not just do a sparge step to get the volume you want and collect the extra free sugars? No special profile needed, just let the program assume you will use full volume but set your expected efficiency up another 5 to 10%.
Because a) I'm doing no-sparge BIAB and b) more importantly, can't easily cool my wort down to pitching temperature if I do a full-volume boil. I can get reasonably close fairly quickly with my immersion chiller, but the temperature of the tap water only gets me to about 28C or so. Adding 6l of chilled water gets me pretty much spot-on, right away.
While we're on the discussion of the Tilt - the Brewjacket uses a sensor taped to the side of the fermentation vessel to monitor temperature. The Tilt, of course, measures the temperature of the wort actually in the fermenter.
The Tilt is consistently measuring about one degree (C) lower than the Brewjacket. Kinda interesting.
The Tilt is consistently measuring about one degree (C) lower than the Brewjacket. Kinda interesting.
Last edited:
LeeH
Well-Known Member
Unless you have calibrated both the comparison could be meaningless.
mirthfuldragon
Well-Known Member
Anyone have problems at the end of fermentation? The last few batches have shown “1.000” or “1.002”. I thought I was getting an infection or something but when I took a hydro it was near what I expected (eg 1.012). [...] I shook the ferm vessel thinking there was dry hop debris, krausen, etc messing with the reading and it didn’t change.
Krausen can get stuck on the top of it, which throws off the tilt. Regardless, my old one (two screw-cap version) did the same thing. It was reliable in that it always read low at the end, so it was still a great tool for monitoring fermentation activity. I added some calibration points, which helped a little.
I had some battery issues with it too, after changing the battery it would not broadcast or hold a calibration reliably. I emailed customer service about the broadcasting issue, and they were really cool about sending me a replacement due to the battery issue, so +1 on customer service.
Both calibrated. Well, technically the Tilt was calibrated, the BrewJacket was tested/confirmed.Unless you have calibrated both the comparison could be meaningless.
Similar threads
- Replies
- 1
- Views
- 448
- Replies
- 0
- Views
- 633
