
http://picasaweb.google.com/prcrawford/Beer/photo#5210694943690048610.jpg


I'm trying to learn Matlab so i was playing around with some simple graphing. Thought you might enjoy this.
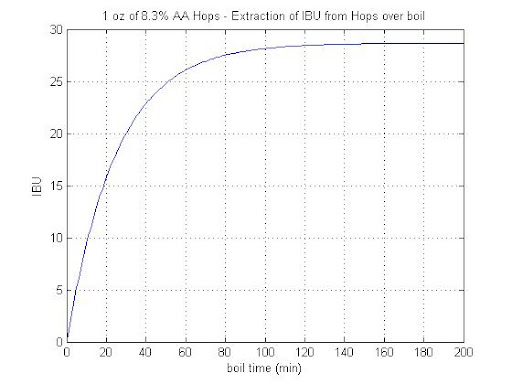
This is a graph of the IBU level as a function of time in a boil.
I picked 1oz, AA%=8.3, Gravity of Boil - 1.050, 5.5 gallon boil
This is using the Glenn Tinseth's equation for IBU calculation
p.s. - not sure why i can't get the image to show up in the post - is it b/c i'm not a paying member?
Enjoy
I'm trying to learn Matlab so i was playing around with some simple graphing. Thought you might enjoy this.
This is a graph of the IBU level as a function of time in a boil.
I picked 1oz, AA%=8.3, Gravity of Boil - 1.050, 5.5 gallon boil
This is using the Glenn Tinseth's equation for IBU calculation
p.s. - not sure why i can't get the image to show up in the post - is it b/c i'm not a paying member?
Enjoy


![Craft A Brew - Safale BE-256 Yeast - Fermentis - Belgian Ale Dry Yeast - For Belgian & Strong Ales - Ingredients for Home Brewing - Beer Making Supplies - [3 Pack]](https://m.media-amazon.com/images/I/51bcKEwQmWL._SL500_.jpg)


