• Please visit and share your knowledge at our sister communities:
  • If you have not, please join our official Homebrewing Facebook Group!

    Homebrewing Facebook Group

Do "professional" brewers consider brulosophy to be a load of bs?

Homebrew Talk

Help Support Homebrew Talk:

This site may earn a commission from merchant affiliate links, including eBay, Amazon, and others.
Status
Not open for further replies.
I'd think in the first case we would actually want both our customers to notice the difference and to show a preference for one or the other. If planning to make such a change I'd want to be convinced customers will be able to tell the difference, and that they show a preference for the more expensive process.

I agree 100% but am, at this point, in a bit of a quandary over this. In my earliest posts in this thread I said that a triangle test consisted of two parts in the first of which panelists were asked to pick the odd beer and then those who correctly picked the odd beer were asked whether they preferred it to the others. I made that assertion because when I was first introduced to triangle testing via the ASBC MOAs that's how the test was described. There were two tables in the MOA. One for significance levels on the odd beer selection and one for the paired test. That second table is not in the current version of the MOA. Beyond this the ASTM triangle procedure specifically states that one should NOT pair a preference question with the odd beer question as having to select the odd beer biases ones choice of the preferred beer. I cannot for the life of me see how this would be the case. I'm still thinking about this. I know I should go delve back into the ASBC archives (if I remembered to pay my dues this year) but am currently working on being sure that I understand the first part of the test (odd beer selection) thoroughly. Insights keep coming.

In the second case since we are hoping customers don't notice the change so there would be an expectation going into the study that the preference data will not be meaningful.

In this case if the sales loss from the cheaper process isn't greater than the cost savings you are ahead of the game and don't care that some small percentage of the customer base doesn't like the beer any more. But suppose you decide to try adding more rice and water and less barley and find the customer base prefers the new beer! Nirvana! Bud Light. So you may care about preference in this case too.


To be honest I still get lost in the math and have taken statistics and am not repelled by the science.
I do too. I've been doing this stuff since the late 60's but still have to check on which is Type I and which is Type II error. And every time I have to do that I picture Kevin Klein in "A Fish Called Wanda" asking "What was the middle thing?" I do believe, however, that AZ_IPA has forever solved that problem for me. It's the look on that guy's face.

But I'd of reached the same conclusions as your two hypothetical brewers in this example simply by looking at 14/40 result.
I've often stepped back after an analysis and said to myself "Why did I go to all that trouble? It's kind of obvious from the raw data!" If we have enough data it usually isn't necessary to do more than look at the mean and standard deviation and, based on experience, draw a conclusion. It's often obvious whether that conclusion is 'significant'. We use statistics when we don't have enough data. Statistics attach a number to our uncertainty. We can declare that p < 5% for a test to be meaningful. How about p < 7.2%. Are you really that much more assured at 5% than 7.2%. In either case you are uncertain.

Looking at several of the Brulosophy tests as I did a couple of posts back it is clear that the main criticism that could be leveled against them is that they use panels that are too small to allow them to draw firm conclusions.
 
I never expect a non-technical reporter to get the technical stuff exactly right. And headlines are written to sell newspapers (or page views). But the popular phrase "I never trust the media" often means "they are deliberately lying to us", which is quite a different proposition.

I can understand why you would conflate the two, because most of the people who say "I don't trust the media" for political reasons tend IMHO to believe that the "left-wing media" is a cabal of people advancing an agenda.

I'm not saying that. I'm saying that people whose only qualification is a journalism degree, and not expertise in a subject area, are incapable of understanding the nuance and complexity of a subject--and basically every subject has nuance and complexity just under the surface.

As I said, I'm in data storage. I work for a company that builds/sells both HDDs and SSDs. I constantly see tech journalists predicting the demise of HDD and that SSDs will soon take over the market without understanding the economic limitations on increasing NAND output to meet worldwide data storage demands. Without NAND, you don't have SSDs. And NAND output doesn't easily scale. It's really not a difficult thing to understand, but tech reporters don't get it. They're either well-versed in tech (and not economics, business, etc), or they're J-school grads who are JUST savvy enough in tech to not get laughed out of a room.

I'm not saying that the media is deliberately lying to us. I'm saying that for any reasonably complex subject area, the typical journalist doesn't have the depth to reasonably know truth from fiction.
 
  • Like
Reactions: Kee
A different proposition, so what? The media does engage in deception and lying; "deliberate" is superfluous as a lie is deliberate by any definition.

I don't want to further derail this thread (someone could start a thread in the debate forum). I do agree my use of the word "deliberate" in said context was redundant.
 
Here is more data on the first 33 Brulosophy experiments. It includes the ones I posted earlier. I've added at the end of each data line a I if the experiment was significant to the 0.05 with respect to Type I errors and a II if it was significant to the 0.05 level with respect to Type II error assuming differentiability of 0.2.

Of these 33 experiments 12 (36%) were significant with respect to Type I error (the only type the experimenters considerd) meaning that the hypothesis that tasters could tell the difference could be confidently accepted. But another 6 (18%) were significant with Type II error. The investigators statements about these tests is exemplified by their comments with respect to the last test in the data table below:

...suggesting participants in this xBmt were unable to reliably distinguish a beer fermented with GY054 Vermont IPA yeast from one fermented with WY1318 London Ale III yeast.
That's not a suggestion. There is good reason to believe that the beers are indistinguishable.

The following information is being shared purely to appease the curious and should not be viewed as valid data given the failure to achieve significance.
The experiment did acheive significance at the 0.04 level. We can say, with confidence at that level, that no more than 20% of the population represented by the taste panel would be able to distinguish beers brewed with these two yeasts. We can also say with 0.002 confidence that no more than 30% can. But our confidence that no more than 10% can tell the difference zooms to 28%

In many cases it's clear that a simple increase in the panel size would have yielded statistical significance. It is a real pity that these guys went to all this work (there are pages of these things) without consulting a statistician. These experiments could have been a goldmine to those who wish to ignore the statistical aspects (take them for what they are, not what we want them to be) but also to those who want to understand what they really mean. Even so there is quite a bit of usable data to mine. IMO if these folks want to go forward they should immediately obtain the standard and refrain from the practices which flagrantly violate it such as presenting two of one type of beer and one of the other and serving the beers in different colored cups. They should also use the Table in the standard to pick panel size.

Does this "professional" brewer think these experiments are a load of BS? No though he does see problems with them.

Experiment ; Panelists ; No. Correct ; p Type I ; p Type II ; MLE Pd ; Z ; SD ; Lower Lim ; Upper Lim
Hochkurz ; 26 ; 7 ; 0.8150 ; 0.0118 ; 0.000 ; 1.645 ; 0.130 ; 0.000 ; 0.215 II
Roasted Part 3 ; 24 ; 10 ; 0.2538 ; 0.2446 ; 0.125 ; 1.645 ; 0.151 ; 0.000 ; 0.373
Hop Stand ; 22 ; 9 ; 0.2930 ; 0.2262 ; 0.114 ; 1.645 ; 0.157 ; 0.000 ; 0.372
Yeast Comparison ; 32 ; 15 ; 0.0777 ; 0.4407 ; 0.203 ; 1.645 ; 0.132 ; 0.000 ; 0.421
Water Chemistry ; 20 ; 8 ; 0.3385 ; 0.2065 ; 0.100 ; 1.645 ; 0.164 ; 0.000 ; 0.370
Hop Storage ; 16 ; 4 ; 0.8341 ; 0.0207 ; 0.000 ; 1.645 ; 0.162 ; 0.000 ; 0.267 II
Ferm. Temp Pt 8 ; 20 ; 8 ; 0.3385 ; 0.2065 ; 0.100 ; 1.645 ; 0.164 ; 0.000 ; 0.370
Loose vs. bagged ; 21 ; 12 ; 0.0212 ; 0.7717 ; 0.357 ; 1.645 ; 0.162 ; 0.091 ; 0.624 I
Traditonal vs. short ; 22 ; 13 ; 0.0116 ; 0.8301 ; 0.386 ; 1.645 ; 0.157 ; 0.128 ; 0.645 I
Post Ferm Ox Pt 2 ; 20 ; 9 ; 0.1905 ; 0.3566 ; 0.175 ; 1.645 ; 0.167 ; 0.000 ; 0.449
Dry Hop at Yeast Pitch ; 16 ; 6 ; 0.4531 ; 0.1624 ; 0.063 ; 1.645 ; 0.182 ; 0.000 ; 0.361
Flushing w/ CO2 ; 41 ; 15 ; 0.3849 ; 0.0725 ; 0.049 ; 1.645 ; 0.113 ; 0.000 ; 0.234
Boil Vigor ; 21 ; 11 ; 0.0557 ; 0.6215 ; 0.286 ; 1.645 ; 0.163 ; 0.017 ; 0.555
Butyric Acid ; 16 ; 9 ; 0.0500 ; 0.6984 ; 0.344 ; 1.645 ; 0.186 ; 0.038 ; 0.650 I
BIAB; Squeezing ; 27 ; 8 ; 0.7245 ; 0.0228 ; 0.000 ; 1.645 ; 0.132 ; 0.000 ; 0.217 II
Dry Hop Length ; 19 ; 3 ; 0.9760 ; 0.0010 ; 0.000 ; 1.645 ; 0.125 ; 0.000 ; 0.206 II
Fermentatopm Temp Pt 7 ; 22 ; 11 ; 0.0787 ; 0.5415 ; 0.250 ; 1.645 ; 0.160 ; 0.000 ; 0.513
Water Chemistry Pt. 8 ; 22 ; 8 ; 0.4599 ; 0.1178 ; 0.045 ; 1.645 ; 0.154 ; 0.000 ; 0.298
The Impact Appearace Has ; 15 ; 7 ; 0.2030 ; 0.4006 ; 0.200 ; 1.645 ; 0.193 ; 0.000 ; 0.518
Stainless vs Plastic ; 20 ; 6 ; 0.7028 ; 0.0406 ; 0.000 ; 1.645 ; 0.154 ; 0.000 ; 0.253 II
Yeast US-05 vs. K-97 ; 21 ; 15 ; 0.0004 ; 0.9806 ; 0.571 ; 1.645 ; 0.148 ; 0.328 ; 0.815 I
LODO ; 38 ; 25 ; 0.0000 ; 0.9863 ; 0.487 ; 1.645 ; 0.115 ; 0.297 ; 0.677 I
Yeast WLP001 vs. US-05 ; 23 ; 15 ; 0.0017 ; 0.9424 ; 0.478 ; 1.645 ; 0.149 ; 0.233 ; 0.723 I
Whirlfloc ; 19 ; 9 ; 0.1462 ; 0.4354 ; 0.211 ; 1.645 ; 0.172 ; 0.000 ; 0.493
Yeast: Wyeast 1318 vs 1056 ; 21 ; 12 ; 0.0212 ; 0.7717 ; 0.357 ; 1.645 ; 0.162 ; 0.091 ; 0.624 I
Headspace ; 20 ; 11 ; 0.0376 ; 0.7002 ; 0.325 ; 1.645 ; 0.167 ; 0.051 ; 0.599 I
Yeast US-05 vs. 34/70 ; 34 ; 25 ; 0.0000 ; 0.9986 ; 0.603 ; 1.645 ; 0.113 ; 0.416 ; 0.790 I
Hops: Galaxy vs. Mozaic ; 38 ; 17 ; 0.0954 ; 0.3456 ; 0.171 ; 1.645 ; 0.121 ; 0.000 ; 0.370
Storage Temperature ; 20 ; 12 ; 0.0130 ; 0.8342 ; 0.400 ; 1.645 ; 0.164 ; 0.130 ; 0.670 I
Yeast Pitch Temp Pt. 2 ; 20 ; 15 ; 0.0002 ; 0.9903 ; 0.625 ; 1.645 ; 0.145 ; 0.386 ; 0.864 I
Corny vs. Glass Fermenter ; 29 ; 16 ; 0.0126 ; 0.7682 ; 0.328 ; 1.645 ; 0.139 ; 0.100 ; 0.555 I
Brudragon: 1308 vs GY054 ; 75 ; 28 ; 0.2675 ; 0.0405 ; 0.060 ; 1.645 ; 0.084 ; 0.000 ; 0.198 II
 
In many cases it's clear that a simple increase in the panel size would have yielded statistical significance.

<sigh>

This is true only if the proportions stayed the same or increased--which they may or may not do. It's entirely possible that larger sample sizes yield the same or even less significant results.

You cannot hold the proportions constant, assume an increase in sample size, and conclude that a larger sample size would have resulted in significance. It might well have resulted in the opposite. AJ, you want to argue the value of random guessing but then when it comes to this, you don't want randomness--you just want an increase in "n" without the attendant randomness in results.

The whole point of the formulas is that they already control for sample size. It's seen clearly in this formula:

zformula.png

The "n" in the formula is sample size. P-hat is the sample proportion, P is the proportion from the null, and Q is 1-P.

As "n" increases any particular result is more likely to be significant. But this presumes that there are no changes to the results which, under the null hypothesis, there quite possibly could be. That's what randomness does.
 
This is true only if the proportions stayed the same or increased--which they may or may not do. It's entirely possible that larger sample sizes yield the same or even less significant results.

But not probable. Here's how it works. Suppose we have a panel whose members can differentiate with probability Pd = 0.2 i.e. the signal is not very strong. With Pd = 0.2 in a triangle test the probability of a correct guess is Pc = Pd(1 - 1/3) + 1/3 = 0.4667. The fraction of observed correct guesses by a panel of M members is a binomially distributed RANDOM VARIABLE with mean Pc and standard deviation Sqrt(Pc*(1-Pc)/M). In the test we examine what the percentage of correct guesses tells us about the probability the null hypothesis is true. Under the null hypothesis (Pd = 0); Pc = 1/3 and the distribution of the fraction of correct hits is a binomial RANDOM VARIABLE with mean 1/3 and standard deviation sqrt(2/(9*M)).

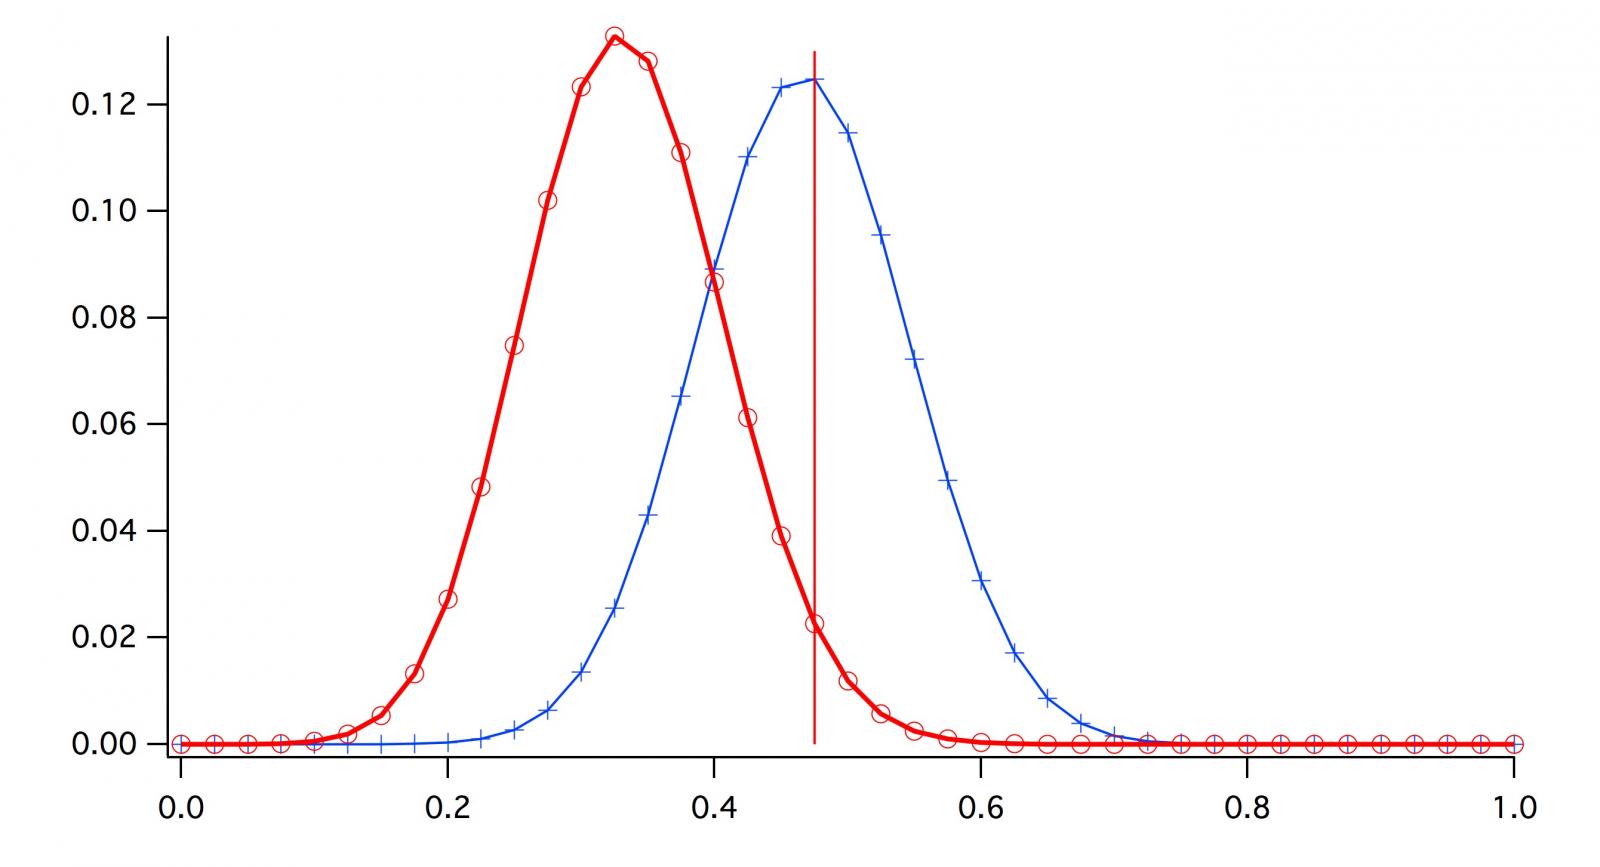
For M = 40 the distribution under the null hypothesis is given by the red 'curve' in the figure below. The binomial distribution is discrete and the circles show (on the vertical axis, the probability masses associated with each possible discrete value for Pc (the faction of correct answers). For a particular observed correct answers the significance (probability that the data can be explained by the null hypothesis) is the sum of the masses on the red curve to the right of, and including, the mass corresponding to N/M (N is the number of correct guesses and N/M is the estimate of Pc).

The blue curve represents the distribution of correct guesses for M=40 under the hypothesis that Pd = 0.2. The two curves overlap quite a bit. The probability of a correct guess result that lies well to the left of where it needs to for a desirable significance level is quite high. The vertical line connects the most likely fraction of observed correct guesses. It doesn't lie very far out on the tails of the null hypothesis distribution. About half the mass of the blue 'curve' lies to the left of that line and little out on the tail of the red curve. It is apparent that the probability of attaining good significance with M = 40 is small at this signal level.

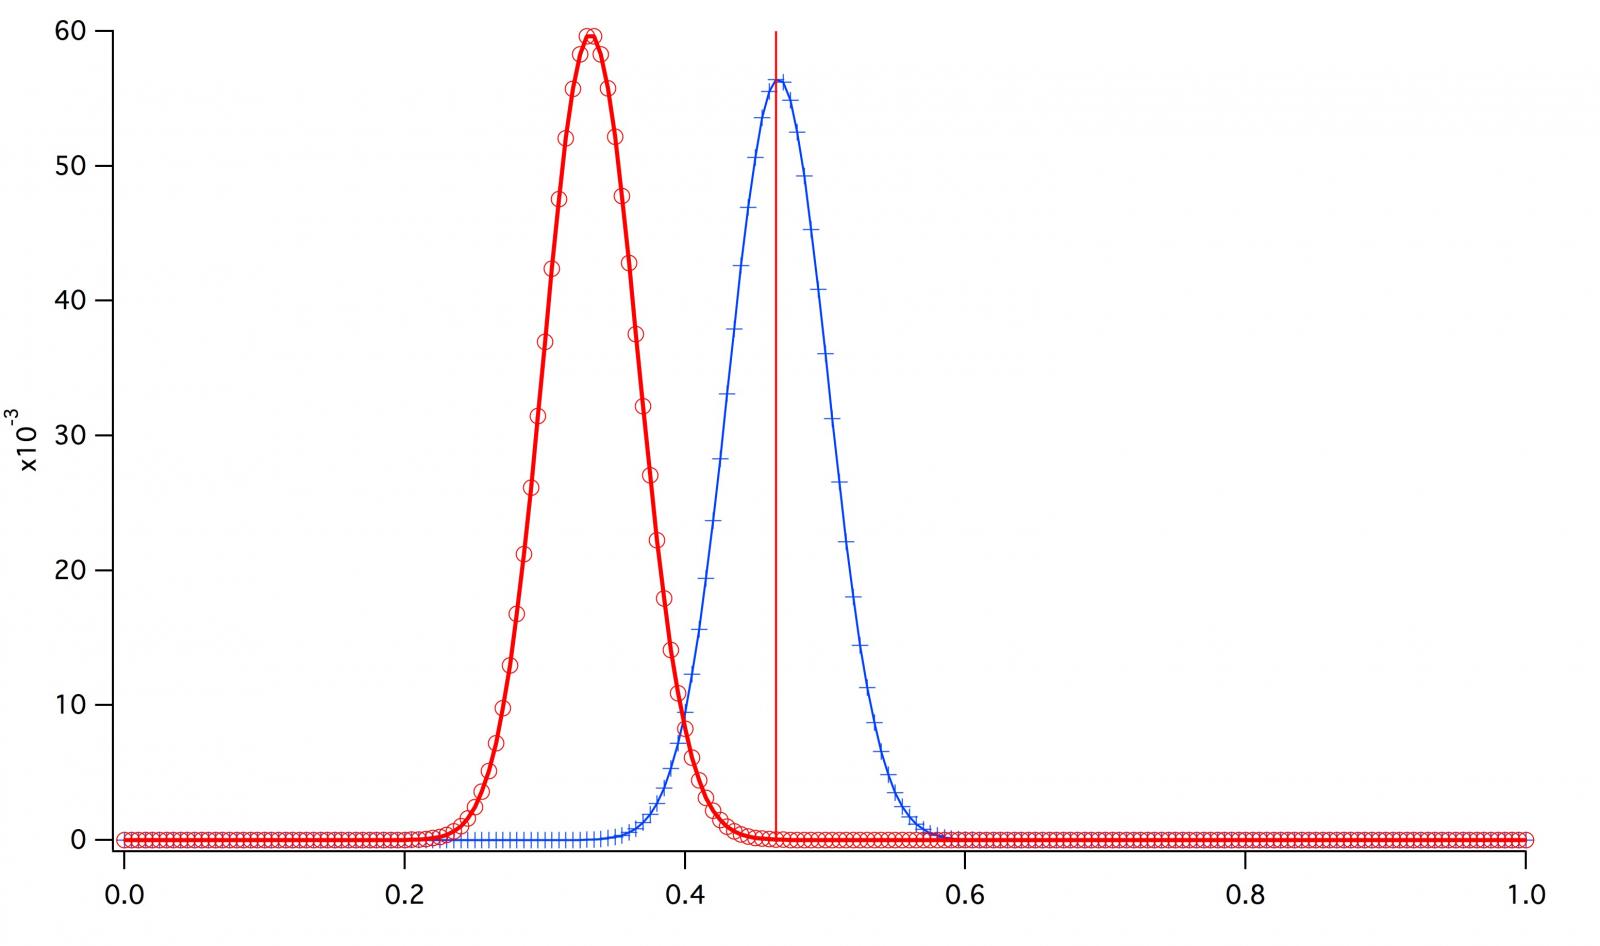
Now compare to the lower curves which are for M=200. Now I know perfectly well that M = 200 isn't a practical panel size but I chose it to make things very clear. Both distributions have narrowed (by a factor of sqrt(200/40) but their means have not changed. There is, thus, much less overlap. The most likely fraction of observed correct answers is now further out on the tails of the red curve as is the bulk of the blue curve mass. If we simply quintuple the panel size is there a guarantee that the fraction of correct answers will be the same? No but there is an awfully good chance that it will be within 2*Sqrt(Pc*(1-Pc)/N) which equals ±0.07 for M = 200 and ± 0.16 for M = 40.

A little surprised you didn't know about this.

You cannot hold the proportions constant,
I wouldn't do that.

...assume an increase in sample size, and conclude that a larger sample size would have resulted in significance. It might well have resulted in the opposite.
It can result in the opposite but as the curves show it is not probable that it will do so. On average, at least, it should be clear that increasing sample size increases the sensitivity of the test.

Are you familiar with the SEM (standard error in the mean)? If we take a series of measurements and average them the result is a random variable with mean given by the average and standard deviation given by the sample variance divided by the number of measurements - this is the SEM. Just as is the case here if we find the SEM too large we increase the number of measurements. Does this always guarantee improved accuracy? No, but it does most of the time.

AJ, you want to argue the value of random guessing
I think we have solidly established the value of guessing in a discrimination test - not much left to argue.

..but then when it comes to this, you don't want randomness--you just want an increase in "n" without the attendant randomness in results.
No, I don't want randomness but I haven't much choice as we are dealing with non deterministic events here. What I can do is reduce the randomness by increasing the sample size. Are you familiar with the concept of entropy? Statisticians, physicists, communications engineers etc. use it to measure disorder i.e. randomness. Since these binomials are pretty close to Gaussians I think we can use the entropy for the gaussian distribution. It is H = 0.5*ln(2*pi*variance). When I reduce the variance Pc*(1-Pc)/N I reduce the entropy.


The whole point of the formulas is that they already control for sample size. It's seen clearly in this formula:
The formula says that the critical value increases as N increases which means you are farther out on the tail of the null hypothesis distribution with resulting better (smaller) confidence. What you are ignoring is that as N increases the width of the distribution of the correct answers fraction also narrows meaning that one is, with high probability, out on the tail further still.

Binom40.jpg


Binom200.jpg
 
For "fun" -- and completely independent of AJ's efforts seen above, I can assure you -- I too spent many hours today reviewing every xbmt again in some detail, with my goal to determine whether panel size was sufficiently large in each xbmt in accordance with the ASTM Table A1.1, with inputs of alpha and beta = 0.20 and pD = 30%. All of these inputs are quite "generous" in my opinion. They basically mean that in order to achieve just 80% confidence (p<0.20) -- not even 95% (p<0.05) -- they really should require a minimum of 20 panelists. If they still insist on trying to achieve 95% confidence (p<0.05), then they really should require at least 40 panelists, otherwise it's just not meeting sensitivity requirements. We don't see 40+ panelists too often. But just shooting for 20 panelists, yeah, they're meeting that minimum most of the time these days... albeit usually they're just barely there right at 20, 21, 22, or 23, and like I've been saying for a loooong time, should only be reporting significance for p<0.20, not p<0.05. Perhaps it's just not very feasible to try to find more panelists for every xbmt, but it sure would be "nice" if they could. Humble thought to ponder. On the other hand, there were only a couple small handfuls of xbmts where they were grossly fewer than the ASTM standard minimum of 20 panelists, so that's cool. Far better than I originally thought actually. The vast majority have hit 20+ panelists which is great.

This is all the more reason why I personally won't bother to run any more semi-formal experiments. For my one where I kind of tried to emulate Brulosophy, I ended up with just 16 panelists, and the results just didn't seem right to me either, I think due to my own ****tiness as a homebrewer. My local club only has like 20 members, so even if I could come up with a decent set of beers to taste, I'm pretty much guaranteed to never reach the minimum number of panelists just shooting for 80% confidence, much less 95%. All my experiments would get to is "maybe kinda sorta there *might* be something going on here, on a good day, maybe". That's my interpretation of 80% confidence, and I couldn't even get there. Probably would have to say only 70% confidence, which is pretty dang weak!

The xbmts at B.com have been a little better than that -- a little. They're a lot of fun to talk about and think about and play around with, but truly (and they'll tell us the same thing themselves), they're also not anything to go jumping to any concrete conclusions from. Could be a launching point for further experiments, which is great if that's the real intent. I know that much is being achieved. People are getting very interested in running their own experiments, which is fantastic.

For what it is, it's cool. Could be better. But it's cool. I do appreciate very much all they've done and are doing. It's more data points, no matter how we might scrutinize it or how insignificant. It's still data, worth a little bit of thought. Not a lot. I know I'm going overboard analyzing things, but that's me, that's what I do, and I'm okay with it. :D

A couple of their truly most significant findings that I think are real and confirmed by multiple sources:

Beer geeks just cannot seem to discern differences in lagers where the primary fermentation was executed warm all the way up to friggin 72 F. This has been seen multiple times with multiple strains, so much that I myself am now trying this on two lagers with two different strains to see what happens. I should know more in a couple more weeks.

Excerpt from my spreadsheet: "a really ****ty LHBS crush adversely affects efficiency AND flavor". This was my own conclusion, right wrong or indifferent, based on my read of the 11/23/15 xbmt on the effect of crush. I'll have to run some more experiments in this regard, as my last couple experiments related to this (yes I've already run not one but two, and BOTH) got screwed up by yours truly. Like I said, I really shouldn't be the one to run any experiments on my own! But also I just can't help myself either. :)

Enough babbling from me again. Cheers all and good night.
 
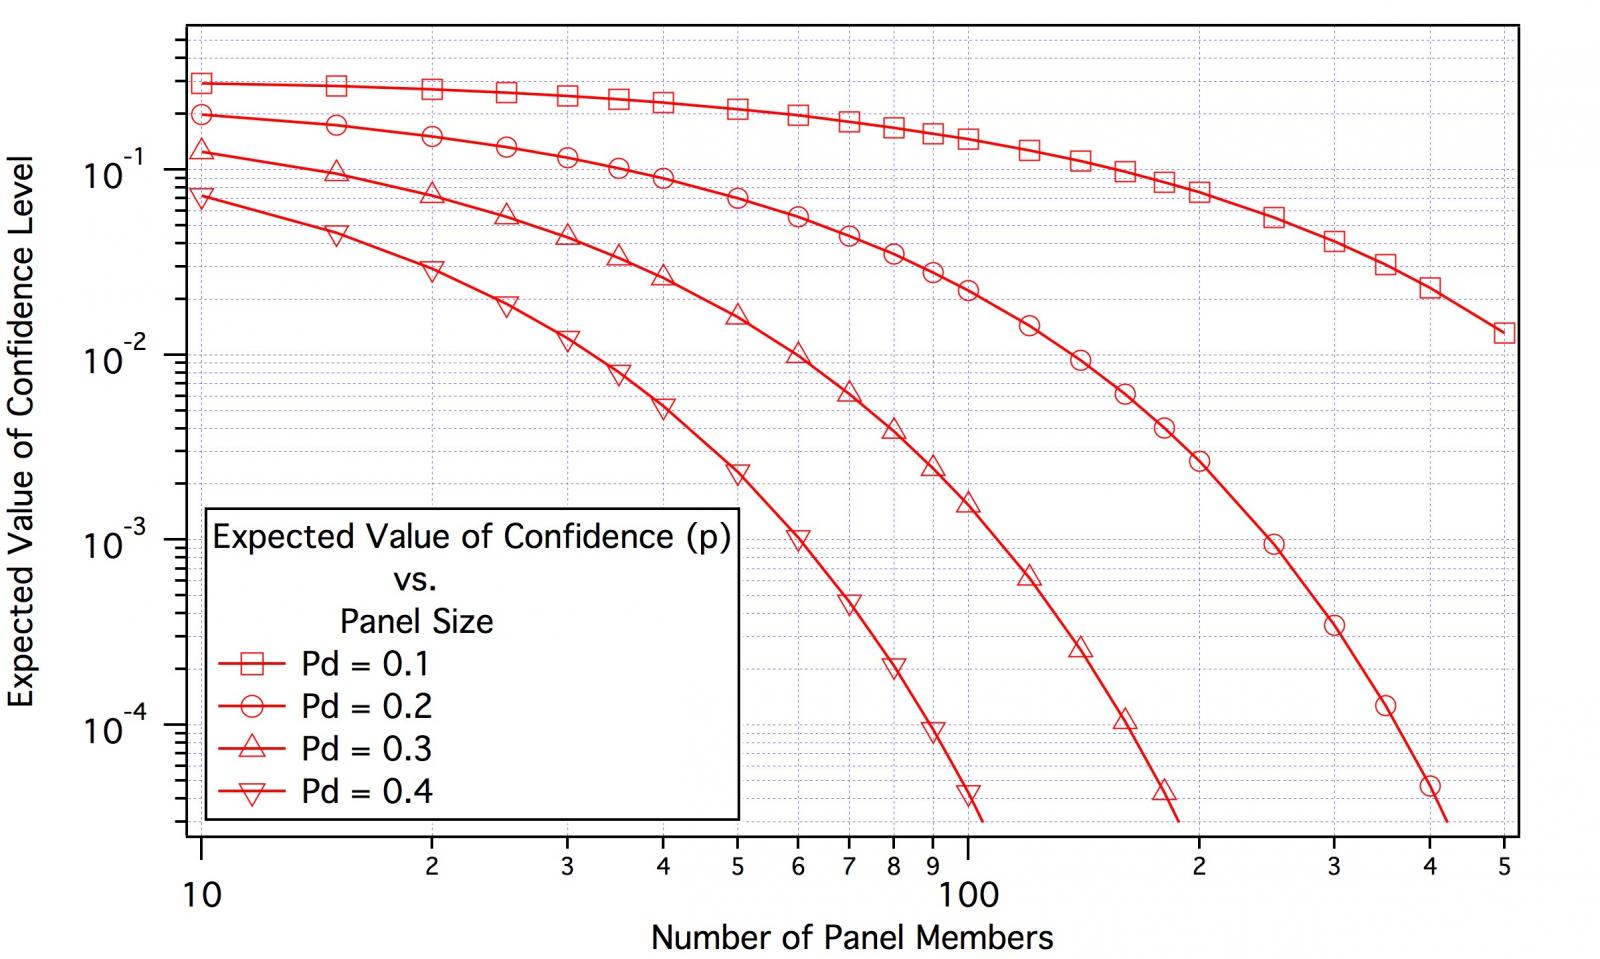
I cooked up the attached chart mostly to help mongoose understand what happens as we increase panel size but it should be valuable to anyone, including Brulosopher, in sizing panels. It shows the expected value of the confidence level (p) as a function of the signal strength (differentiability, Pd) and panel size. Now these are expected values (averages) and the distribution of p does have a variance associated with it so keep in mind that choosing a panel size from these curves only tells you that the average experimenter will get the indicated confidence level while some experimenters will get a better confidence and some worse. The obvious thing to do to insure the desired result is take what the curves show and add a pad.

The expected confidence level is strongly dependent on differentiability. No surprise there! As one usually doesn't know that at the outset that makes the curves difficult to use. In casual tasting of the two beers one should get some idea as to where Pd lies. If the investigator can't quite make up his mind whether he can tell there is a difference in casual tasting it is clear that Pd is small and he is going to need a large panel. OTOH if the difference really hits him in the face then it is clear the Pd is larger and a smaller panel can be used.

BinomialsExp.jpg
 
Well, there was one way that I've now made brulosophy "actionable".

I brewed a pilsner yesterday and my recipe called for 4% AA Saaz. When I got to the LHBS, they only had 2.2% Saaz, so I bought about double what I originally planned. So I read this:

http://brulosophy.com/2016/07/18/bittering-hops-pt-2-high-vs-low-alpha-acid-exbeeriment-results/

And saved myself another trip to the brewstore to get a different bittering hop like Magnum. And I used 10 oz of bittering hops in an 11 gal batch.

Of course, now I have to figure out how to unclog my CFC. Where's the XBMT for that? :(
 
But not probable.

Again, <sigh>

AJ, you're trying to teach Grandpa how to suck eggs. I already know that you don't really understand this stuff, and that was evident earlier in your misunderstanding of reliability and validity, and now in your statement that a result would be significant if a larger panel were used. That's a game, set, match type of comment.

And you present all kinds of handwaving to try to buttress....some sort of point. Not sure. You're not correct, and so even if what you post *is* correct, it isn't a defense of what you wrote.

It isn't.

I teach this material. I know it very, very well. You are a journeyman when it comes to this. If this were a water thread, I'd bow to your knowledge, which appears to be very good.

But this is not a water thread. Your attempt to deflect explanation of the misunderstanding is analogous to what I see people do in some fields, where if an analysis doesn't yield significance at the .05 level, they relax it to the .10 level. In other words, we're going to show something matters even if we have to change the rules to make it so. I always laugh at that, and whenever I see it, I know what they know about statistics--not much.

You can keep posting charts and graphs until you're blue in the face, but that changes nothing--it just makes it appear, to the casual reader, that you in fact have an argument, when you do not.

None of this makes you a bad person, but in this area, you might find it advantageous to listen more and post less.
 
The other day I went into my back yard, heated some water, soaked a few pounds of grain, added some hops and yeast and stuff...and tonight I am sitting on the deck drinking the result. That water somehow turned into a tasty beverage. Go figure.

Before that I read a few exbeeriments and my take away was my beer should be OK if I mash at 153 instead of 151.5, or if I ferment at 64 instead of 62.11. I didn't take away this as gospel, or the new brew dogma, or even a path to get my masters. Just some guys in a garage who like to brew and want to play around with "what ifs" for the rest of us schmucks to read or not read, believe or not believe.

My thoughts: Take your p-value argument to the science room so there is some other "science" there except "water"!

Cheers! I am going to finish my home beer! :fro:
 
If you don't enjoy the discussion going on here, then you're free to ignore it.

As AJ said, some of us want to know what the numbers are actually saying, because as we've seen from a few posters in this thread (and even more so ALL OVER THIS SITE), people are taking these exbeeriments and saying, "See none of this sh!t matters!" Yet we all know from our own experiences that it often does.

Now we know from looking further into the data, that them (or maybe just the crazies who go around claiming it for them) saying that it's not significant might not be true. Because for most of them, they haven't reached a low enough threshold in order to say, "see this doesn't matter." The only thing they've proven with some of these is that it *might not* matter. But then when we see it taken from a larger sample size, the numbers say, "actually this likely does matter."

This stuff is important to us. Sure, it might not be attempts at curing cancer, but that doesn't mean we don't find significance in this sort of discussion in OUR lives. That's all there is to it. If you don't enjoy the fact that some of us are enjoying the discussion, then, again, you're free to ignore it.

The other day I went into my back yard, heated some water, soaked a few pounds of grain, added some hops and yeast and stuff...and tonight I am sitting on the deck drinking the result. That water somehow turned into a tasty beverage. Go figure.

Before that I read a few exbeeriments and my take away was my beer should be OK if I mash at 153 instead of 151.5, or if I ferment at 64 instead of 62.11. I didn't take away this as gospel, or the new brew dogma, or even a path to get my masters. Just some guys in a garage who like to brew and want to play around with "what ifs" for the rest of us schmucks to read or not read, believe or not believe.

My thoughts: Take your p-value argument to the science room so there is some other real science there except "water"!

Cheers! I am going to finish my home beer! :fro:

ICYMI

and FTFY

If you don't like statistics, then avoid the discussion. If you don't like science, then avoid the discussions. For the most part, there isn't "science" being discussed there, but the real thing. And this topic being discussed is very much still relevant to the OP because these are professionals explaining the merits of the brulosophy findings/conclusions.
 
AJ, you're trying to teach Grandpa how to suck eggs.
Apparently Grandpa needs a refresher on some fundamental concepts.

I already know that you don't really understand this stuff, and that was evident earlier in your misunderstanding of reliability and validity,
Taking validity first we note that in a triangle test we can observe the number of correct answers and relate it to the parameter of interest by Pd = (Pc -1/k)/(1-1/k). Thus Pc is a valid thing to test in order to get and estimate of the state variable of interest. Now with respect to reliability, we know that people have self noise and biases. We note that it is important in conducting a triangle test to minimize those noises and biases and we know ways to decrease the extent to which that noise degrades the estimate. It seems we do know about reliability and validity after all but statisticians in the real sciences, engineers and physicists may be more likely to discuss measurability, ergodicity and stationarity rather than in terms of validity and reliability.

..and now in your statement that a result would be significant if a larger panel were used. That's a game, set, match type of comment.
Yes it is as the truth of my statement is just common sense. Or at least it is to someone who has spent as much time as I have looking at data corrupted by noise. I have explained how this works and even given a chart that shows expected significance vs panel size parametric in Pd. You are saying that the chart is invalid and are claiming it to be so because I am a tyro when it comes to this stuff. Your argument would be a lot more convincing if you could critique my method or my results (which would also require you to explain why Table A1.1 in ASTME1885, which shows better confidence with increased panel size, is wrong.)

When, in another post, you asserted again that I didn't understand reliability and presented a sequence of widely varying weights as representative of unreliable data and I responded by showing you how to get 'actionable' information from it you chose to ignore it as you do with most of my rebuttals. And there are rebuttals in that case. If you had said that the scale's noise were non ergodic or non stationary then indeed the sequence would be unreliable. Had you said that I would have concluded that you know what you are talking about but as you just ignored the rebuttal I had to assume that you couldn't rebut my point and accept the alternate hypothesis.


And you present all kinds of handwaving to try to buttress....some sort of point.
There have been several rather distinct points
  • Triangle tests are not inherently flawed. They can yield useful information to brewers
  • The essence of the triangle test is forced guessing
  • Increasing panel size improves the sensitivity of the test
  • Improperly done triangle tests can lead one astray. Care is needed
  • Increasing the order of the test from binary to triangle to quad increases the sensitivity

Not sure.
I don't see how you could have missed those as each was followed by analysis, graphs and numerical examples.

You're not correct,
If I were not correct then you should be able to refute some of the points more solidly than just fuming that I am a tyro and thus have no right to express an opinion. But, as you can't seem to figure out what those points are obviously you can't do that. If you can't figure out what the points are how can you reasonably offer an opinion as to whether they are correct or not other than to claim that the reporter is globally disqualified? This is the approach you have taken and it is not one that leads to fruitful dialogue. And, ultimately, I am, of course, correct as I have justified my positions using sound principles most of which are found in fundamental texts on probability, statistics, estimation theory and so on. Furthermore, all the points except the last one above are supported by the fact that the triangle test is widely accepted and used by thousands of scientists. The third point is obvious.

..and so even if what you post *is* correct, it isn't a defense of what you wrote.
Huh?

I teach this material. I know it very, very well.
I think the basic problem here may be that you know one corner of statistics - the parts that are used in your field. Statistics is much, much broader than this. You seem unaware of much of the terminology and techniques of the other branches e.g. ROC's, SEM, SNR, entropy, differentiability. At least when I have asked if you are familiar with those terms you have ignored the question.

You are a journeyman when it comes to this.
Well thanks but I think you mean the opposite.

If this were a water thread, I'd bow to your knowledge, which appears to be very good.
Thanks for this compliment too but if you see me say something that doesn't make sense with respect to water (and I have done that) then I don't want you to bow to my experience. I want you to point out what you see as wrong. I'm smart enough to know that just because I have taught it for many years doesn't mean that I'm always right. In fact I've found that those with long experience (the acknowledged 'experts') are quite often wrong on certain points as our memories slowly and subtly drift over time.

I feel that I must point out that while I have been thinking about brewing water for perhaps 20 years I have been applying the statistical concepts I've advanced in this thread for more like 50 yrs to radar, sonar, signal processing, telemetry, communications, orbital mechanics, horology, navigation, antennas, pH measurement and color characterization. I should also point out that I have had very similar discussions with guys re water chemistry They make outrageous statements (e.g. Henry's coefficient is a function of pH) and when bombarded with evidence to the contrary fall back on "I've been teaching it for years. You don't know what you are talking about."

Your attempt to deflect explanation of the misunderstanding...
I have never attempted to deflect explanation of the misunderstandings. I have attacked them directly. I have, in all cases, tried to give you enough information to help you to do some thinking or pencil and paper work or Monte Carlo simulations or even just reading to resolve your misunderstandings. If you can remove the blinders I think you can do that. When you say that increasing panel size may result in the same or reduced significance that is true. You just need to understand that it is true proportionally less and less of the time as panel size increases so that the expected result (are you familiar with the term "expected value"?) goes down. You have to accept that the probable significance levels depends not only on the width of the null distribution but of the alternate distribution. A little thinking should make that obvious. Think rather than dismissing this as hand waving and you'll be there.


..is analogous to what I see people do in some fields, where if an analysis doesn't yield significance at the .05 level, they relax it to the .10 level.
My attempts to clearly explain the principles have nothing to do with changing the confidence levels. I have, though, demonstrated that if one obtains a marginal confidence level he is likely to get improved confidence by repeating the test with a larger panel (or going to a quad rather than a triangle).

In other words, we're going to show something matters even if we have to change the rules to make it so. I always laugh at that, and whenever I see it, I know what they know about statistics--not much.
I wouldn't assume that at all. My old boss used to say "Figures don't lie but liars figure."


You can keep posting charts and graphs until you're blue in the face, but that changes nothing--it just makes it appear, to the casual reader, that you in fact have an argument, when you do not.
Yes, there's nothing like data to mislead people especially when it agrees with published data and that's what I would hope readers would see: AJ's spreadsheet agrees with ASTM E1885 as do his curves thus either AJ is right or AJ and ASTM are both wrong.

It is particularly distressing to me that as of my reading of this post two people had 'liked' it. This means you have taken them in and I have not done a good enough job of stating the case.

None of this makes you a bad person, but in this area, you might find it advantageous to listen more and post less.
You have stated that triangle testing is invalid because it is a forced guessing test. That's wrong. You have implied that only someone who doesn't know anything about statistics would think increasing the panel size would improve the power of a triangle test. That's wrong too. Were I to remain silent there would be more than two people who would accept those incorrect statements.
 
None of this makes you a bad person, but in this area, you might find it advantageous to listen more and post less.

IIRC, this is the second time you've had this sentiment about "this" not making AJ a "bad person." Rip apart his argument if you can, but this a super weird thing to say.
 
and now in your statement that a result would be significant if a larger panel were used. That's a game, set, match type of comment.

You have implied that only someone who doesn't know anything about statistics would think increasing the panel size would improve the power of a triangle test. That's wrong too.

Respectfully, I think you're talking past each other here. If I might try to summarize what I *think* mongoose is saying, given the context, it is this:

Mongoose: "Experiment A obtained X correct samples out of Y tasters, which didn't achieve significance. Thinking you can just extrapolate out to X*3 and Y*3, and the declare significance because the sample size improved, is completely and utterly unsupported by statistics."

AJ: "We can learn some things from Experiment A, despite the fact that it didn't achieve 'significance'. These things are limited due to small sample size, but with a larger sample size, we could be more justified in the veracity of the conclusion we're trying to draw, because larger sample sizes increase the power of triangle testing."

OBVIOUSLY, you can't take an experiment and declare that if the same ratio held but the sample size was larger, it suddenly becomes significant. Because inherent in a small sample size and not declaring something "significant" is the likelihood of achieving that result by chance. Because of the nature of these experiments, that likelihood of chance resulting in the outcome means that you can't manufacture a larger sample size without actually performing an experiment with a larger sample size. And I think we *all* agree on that. I think that was a strawman created by Mongoose, because I didn't see you argue that. But if you had argued that, it would have been flatly wrong.

What AJ argued is that if the sample size was larger, the results are more powerful, as triangle testing is sensitive to sample size. And then AJ started going off on a completely different point, which is that even though the experiment doesn't achieve p<0.05, we can still look at the results in a statistical manner and ask "despite not achieving a low p-value, what can this experiment teach us?"

But nobody is arguing that you can simply carry forth a ratio of responses to a larger sample size without doing the experiment on that sample size. Only that a larger sample size is more sensitive and more powerful than a small sample size. Although the method of performing a meta-analysis suggests you can aggregate similar experiments to improve sample size, but that's a different point.
 
Also, just because someone is a professional brewer does not mean he or she is knowledgeable in the craft. I'm an attorney, and I work for a mortgage company in attorney oversight and compliance (and a bunch of other things) - so I am lawyer who lawyers other lawyers. And a lot of those lawyers are not as swift as one would hope given their hourly billing rate. Half the lawyers I worked with in private practice were not worth a ****, and going to law school is a lot harder than going to Seibel (or at least a lot more expensive).

The same applies to brewing. Think about it - if success is a function of beer quality, then BMC are just killing all the craft breweries five to one (craft beer is 17% of market volume and 20% of market value). Our club has one member who consistently medals at competition (over 25 this year) and also the header brewer at one of our local micros. I listen very carefully when either of them speak.

I just do not get the hate on Brulosphy. Is it gospel? Of course not. At least they are pushing the scientific method by attempting to control variables and publish results and avoid random chance. Personally I think the sample sizes are too small, so they do yield significant data but I wonder what the margin of error calculates out to be, but given the scale, it is a good read and information worth knowing.

My LHBS beer courses still teach to secondary beer, and a lot of my homebrew friends secondary - and you mention the word "secondary" here and in about six seconds someone is going to chime in with "don't do that, it doesn't help and only increases your risk of oxidation, and autolysis is a not an issue at the homebrew scale".

I would guess 75% of the techniques we use and the recopies we use are rote copies of what someone else has said.

/rant over, someone else can get on his or her soapbox now.
I feel theres a blurred line where "Craft" brewing and pro brewing meet... just as theres little comparision between a loaf of bread from a mass produced bread and roll maker and a local old world style bakery... somewhat different priorities and products..
 
I feel theres a blurred line where "Craft" brewing and pro brewing meet... just as theres little comparision between a loaf of bread from a mass produced bread and roll maker and a local old world style bakery... somewhat different priorities and products..

That cuts both ways. My local brewpub that doesn't distribute at all cuts corners all the time, especially on anything that could use some age. He just doesn't have the capacity to sit on product for any length of time. Then you have someone like Sierra Nevada or Stone with warehouses of barrel space... Each end of the spectrum has it's pros and cons.
 
I feel theres a blurred line where "Craft" brewing and pro brewing meet... just as theres little comparision between a loaf of bread from a mass produced bread and roll maker and a local old world style bakery... somewhat different priorities and products..

There's definitely shades of grey in between craft and not craft that depend on personal definitions (unless you simply accept the BA's take on it, which is a political position certainly open to scrutiny).

The line between pro and not pro is very clear cut. It's getting paid or not.

They're measures of different things.

And neither say anything intrinsic about quality.

The only blur between "craft" and "pro" is if you call homebrewers "craft" brewers as well. Which while not the first time I've heard that, it's not a typical position in my experience. But to each their own.
 
...I've seen tables here but darned if I know how to put one in....

Here you go:
Code:
Experiment               Panelists  No. Correc p Type I   p Type II   MLE Pd        Z         SD      Lower Lim  Upper Lim     Cat
Hochkurz                    26          7        0.815     0.0118        0        1.645      0.13         0        0.215       II
Roasted Part 3              24         10       0.2538     0.2446      0.125      1.645      0.151        0        0.373
Hop Stand                   22          9        0.293     0.2262      0.114      1.645      0.157        0        0.372
Yeast Comparison            32         15       0.0777     0.4407      0.203      1.645      0.132        0        0.421
Water Chemistry             20          8       0.3385     0.2065       0.1       1.645      0.164        0        0.37
Hop Storage                 16          4       0.8341     0.0207        0        1.645      0.162        0        0.267       II
Ferm. Temp Pt 8             20          8       0.3385     0.2065       0.1       1.645      0.164        0        0.37
Loose vs. bagged            21         12       0.0212     0.7717      0.357      1.645      0.162      0.091      0.624        I
Traditonal vs. short        22         13       0.0116     0.8301      0.386      1.645      0.157      0.128      0.645        I
Post Ferm Ox Pt 2           20          9       0.1905     0.3566      0.175      1.645      0.167        0        0.449
Dry Hop at Yeast Pitch      16          6       0.4531     0.1624      0.063      1.645      0.182        0        0.361
Flushing w/ CO2             41         15       0.3849     0.0725      0.049      1.645      0.113        0        0.234
Boil Vigor                  21         11       0.0557     0.6215      0.286      1.645      0.163      0.017      0.555
Butyric Acid                16          9        0.05      0.6984      0.344      1.645      0.186      0.038      0.65         I
BIAB Squeezing              27          8       0.7245     0.0228        0        1.645      0.132        0        0.217       II
Dry Hop Length              19          3        0.976      0.001        0        1.645      0.125        0        0.206       II
Fermentatopm Temp Pt 7      22         11       0.0787     0.5415      0.25       1.645      0.16         0        0.513
Water Chemistry Pt. 8       22          8       0.4599     0.1178      0.045      1.645      0.154        0        0.298
The Impact Appearace Has    15          7        0.203     0.4006       0.2       1.645      0.193        0        0.518
Stainless vs Plastic        20          6       0.7028     0.0406        0        1.645      0.154        0        0.253       II
Yeast US-05 vs. K-97        21         15       0.0004     0.9806      0.571      1.645      0.148      0.328      0.815        I
LODO                        38         25          0       0.9863      0.487      1.645      0.115      0.297      0.677        I
Yeast WLP001 vs. US-05      23         15       0.0017     0.9424      0.478      1.645      0.149      0.233      0.723        I
Whirlfloc                   19          9       0.1462     0.4354      0.211      1.645      0.172        0        0.493
Yeast: Wyeast 1318 vs 10    21         12       0.0212     0.7717      0.357      1.645      0.162      0.091      0.624        I
Headspace                   20         11       0.0376     0.7002      0.325      1.645      0.167      0.051      0.599        I
Yeast US-05 vs. 34/70       34         25          0       0.9986      0.603      1.645      0.113      0.416      0.79         I
Hops: Galaxy vs. Mozaic     38         17       0.0954     0.3456      0.171      1.645      0.121        0        0.37
Storage Temperature         20         12        0.013     0.8342       0.4       1.645      0.164      0.13       0.67         I
Yeast Pitch Temp Pt. 2      20         15       0.0002     0.9903      0.625      1.645      0.145      0.386      0.864        I
Corny vs. Glass Fermente    29         16       0.0126     0.7682      0.328      1.645      0.139       0.1       0.555        I
Brudragon: 1308 vs GY054    75         28       0.2675     0.0405      0.06       1.645      0.084        0        0.198       II
 
But nobody is arguing that you can simply carry forth a ratio of responses to a larger sample size without doing the experiment on that sample size.
No, indeed! I though that the frequent use of terms like 'on average' and 'retest' and the fact that I mentioned that some experimenters on retest would obtain worse significance but that the majority would obtain better would have made that clear. But maybe not. Perhaps having it restated by someone else as you have done will make it clearer. Thank you.

There is yet another way of looking at this and that is by information content as I'd hinted in an earlier post. In a triangle test we can look at the observable (the number of panelists picking the odd beer correctly) and see whether the average information changes with panel size. It also depends on Pd (a more powerful signal better conveys information than a weak one) and on k, the order of the experiment. Larger k means less noise.

Information is measured in Shannons in honor of Claude Shannon who invented information theory at Bell Labs way back when. But many people still measure it in bits. One bit equals one Shannon. Shannon found that the english alphabet conveys entropy at the rate of about 4.7 bits per letter. What this practically means is that you need 5 bits to represent and english letter. Add 1 bit for shift and 1 bit for control and you have the 7 bit Baudot code of yore. The letter e, the most common in the language, has 0.378 bits of entropy whereas the much rarer z has 0.278. Thus the letter z conveys 0.1 bit more information than the letter e. I put that in here so you have some sort of idea about how 'big' a bit is.

For a 3-ary test involving 25 panelists the entropy of the observable (fraction correct) for differentiability 0.20 is -1.28 Shannons (bits)
For a 3-ary test involving 50 panelists the entropy of the observable (fraction correct) for differentiability 0.20 is -1.78 Shannons (bits)
For a 3-ary test involving 100 panelists the entropy of the observable (fraction correct) for differentiability 0.20 is -2.28 Shannons (bits)
For a 3-ary test involving 100 panelists the entropy of the observable (fraction correct) for differentiability 0.40 is -2.30 Shannons (bits)

Thus each time we double the panel size on average the entropy is decreased by a half a bit and, as entropy is a measure of disorder, the information conveyed by the observable increases by that amount. This is what every beginning student of statistics knows: things improve as 1/sqrt(M).

Only that a larger sample size is more sensitive and more powerful than a small sample size. Although the method of performing a meta-analysis suggests you can aggregate similar experiments to improve sample size, but that's a different point.
If certain that the multiple tests were done in the same way there is no reason not to combine them. In fact if one is certain that he can repeat the conditions of the test it is doubtless more practical to repeat and combine the data and start over with a new panel of twice the size. The second test should, however, have different panelists. This averages down any biases in the first panel (or second).

The decisions as to panel size should be made with reference to a ROC curve. The data in table A1.1 of ASTM E1885 is ROC curve data. It is a bit hard to see what is going on from a table so here's a look at ROC curves for 25 and 136 panelists.

A brewer looking for confirmation of the effectiveness of a process or material change which he knows suspects is going to mean differentiability of about 0.20 would use the upper curve. He'd like to be pretty sure that if he concludes the effect is real it is indeed real and so wants 0.01 confidence that a detectable difference he calls is real. He looks at the M = 25 ROC curve (because he has 25 tasters) and sees that he can get 0.01 confidence that the effect is real if he detects it but must accept very poor confidence that if he rejects it is really isn't there. This is not acceptable. He wants much more confidence that if he rejects the hypothesis of a differentiable difference he has justification for doing so. The thus consults the M = 136 curve and sees that with 136 panelists he can have 0.01 confidence that he hasn't falsely alarmed (detected a difference) while at the same time enjoying confidence at the 0.2 level that he hasn't falsely dismissed a detectable difference if indeed there is one. So he establishes a threshold at 59 correct answers and resolves to accept the hypothesis of detectability if his panel gives him 59 or more correct answers and reject it if he doesn't. The curve tells him that 136 panelists is enough for this test if Pd = 0.2. It may or may not, of course, equal 0.2 and the confidence levels he actually attains will depend both on Pd and on the randomness of the panel's decisions on the day of the test.

I didn't pick M = 136 because I like that number particularly. I chose it because it appears in Table A.1.1. against alpha = 0.01 and beta = 0.2 for Pd = 0.2. Thus, for this particular example, my curve and the ASTM standard agree. My methods reproduce the ASTM table. Thus one can't accuse me of being wrong. I am following scripture. The scripture of the church of a false god, perhaps, but a god nevertheless.

ROC136.jpg
 
I really like brulosophy. It's easy to read and provides good information. Are there flaws in the method? Sure! Should the results be taken as gospel? Definitely not. But I think the author of the xbeeriments is pretty transparent about the results. He gives the results of the triangle taste test from his cohort of friends which give you some information. He usually gives you the number of people who chose the different sample correctly. And he goes further and ask of those people if they could tell apart giving you the number of people who got lucky on their pick.

I think the three pools of people (those who couldn't pick the odd sample out, those who picked right but did so by luck and those who picked right because they could distinguish the samples) gives you a pretty good idea when a variable tested actually matters. And on top the author gives his own view on the matter as additional information.

Overall, I think brulosophy does a pretty good job at controlling their variables and constants. Would it be nice if they could include 1000 people randomly picked from around the world, and do their experiment 3 times with 3 different groups of people? Of course it would. But the point is they still provide valuable information in a way that's easy to interpret. That's awesome in my book.
 
I really like brulosophy. It's easy to read and provides good information. Are there flaws in the method? Sure! Should the results be taken as gospel? Definitely not. But I think the author of the xbeeriments is pretty transparent about the results. He gives the results of the triangle taste test from his cohort of friends which give you some information. He usually gives you the number of people who chose the different sample correctly. And he goes further and ask of those people if they could tell apart giving you the number of people who got lucky on their pick.


I think the three pools of people (those who couldn't pick the odd sample out, those who picked right but did so by luck and those who picked right because they could distinguish the samples) gives you a pretty good idea when a variable tested actually matters. And on top the author gives his own view on the matter as additional information.


Overall, I think brulosophy does a pretty good job at controlling their variables and constants. Would it be nice if they could include 1000 people randomly picked from around the world, and do their experiment 3 times with 3 different groups of people? Of course it would. But the point is they still provide valuable information in a way that's easy to interpret. That's awesome in my book.


All of that is true, but you can't really do much with their conclusions because you just do not know.
 
We know Marshall commented on this thread earlier, but I do find it interesting that the most recent exbeeriment (posted yesterday) concluded with this:

"It&#8217;s true these results are but a single point of data that ought not be accepted as gospel,..."

I know they often conclude their blogs with something akin to this statement, but I found it curious that Jake decided to insert the word gospel this go round (who knows, maybe I've missed it before?), considering how much we've been blasting those on this thread and about this forum who tout these exbeeriments as gospel.

And even with this latest iteration, besides the questioning of how all of the important controls for the tasters were conducted, if they're trying to single out one variable, why not stick to that variable? Yes they're homebrewers who are likely filling two 5-gallon kegs that they themselves must consume the majority of. But if they're going to test the difference between pale malt and pilsner malt, why also add in a couple of other malts to the ingredient list (no matter how low of a percentage they might be)? Why add hops at different intervals instead of sticking with one 60 minute addition that adds a minimal amount of IBUs, but not enough to mask any differences in the flavor of the malts? Maybe the difference would still be rather negligible.

Then again, as bwarb and AJ have pointed out, this is another one that is above 33%. Not by much, but it still is.

And then, the rest of that conclusive paragraph ends with... "though based on my experience with both of these beers, my previous convictions about the differences between Pale and Pilsner malts have faded. I won&#8217;t be ditching the use of continental Pilsner malt altogether, but I&#8217;ll definitely be using more domestic Pale malt in styles I once believed required the former, especially if the biggest difference is a little more cash in my pocket."

In one sentence, he denounces these results as gospel. In another, he confirms he won't completely stop using pilsner malt. In the last sentence, and the one likely to stick in the average reader's head, he basically accepts the results as confirming enough that he'll stop using them when he deems it unnecessary. He claims it as being "a little more cash in his pocket book," which sounds very utilitarian to the average person. But he also said he buys in bulk. So the average cost difference per batch between the two malts is almost negligible (if a homebrewer is worried about a couple of bucks per batch, perhaps he should be rethinking his monthly budget). But in using this type of language to conclude the blog, it will likely convince many people that it would be completely ok to abandon pilsner malt if they just want to go ahead and use pale malt.

Now take this type of language for this one particular exbeeriment, and extrapolate it over several. All of a sudden, if someone wants to brew a traditional czech pilsner, they've determined based on the language of these exbeeriments that the following are not necessary in order to make a good rendition of the style: malt choice, mash temperature, mash length, mash pH, using decoctions, vorlauf-ing, specific bittering hops, boil length, boiling with a lid on, fermentation temp (too many to link), fermentation timeline, yeast pitch rate, etc. And most of all, the fact that even if you compound all of these wrongdoings together, no worries! You'll still end up with only imperceptible differences in your beer!

Oh, wait a minute...

You see, while some of you here may be professionals in statistics, I've always been focused on their language, as that's my expertise (I'm at a nearly fluent level in two other languages besides English). And although they usually try to preface the conclusions in their closing paragraphs, they also usually insinuate that they're probably willing to give up the generally accepted rules for that particular data point. Thus contradicting themselves in the very same paragraph.

Yet, as their traditional vs. short and shoddy (aka compounding all the variables from each "confirmed") experiment showed, maybe having one particular aspect of your brew day go wrong won't completely ruin your beer. But maybe having all of these variables changed all at once will in fact produce a subpar beer.

IOW, in my estimation, their language is just as dangerous as the testing methods they're using, if not more so.
 
To me Brulosophy shows that there is a lot of latitude in the tolerances of the beer making process, and I'm thankful for that. If the latitude range was not as broad as it is, the world of home brewing would be a much smaller one.

I only wish that they would quit making so many IPA derivatives, and concentrate upon more subtle styles. You can hide a lot behind a massive infusion of hops. They should perhaps settle upon one subtle recipe, to eliminate the recipe itself as a variable. Then later move to another and noticeably different recipe and repeat each experiment.

https://mashmadeeasy.yolasite.com/
 
I think the professional community would be ambivalent to these experiments. Very few of them have direct applicability to professional processes and/or equipment.

Statistical analysis at the professional level tends to focus on internal QA/QC for process control against a set of standards, usually determined internally and documented through SOP.

Sensory analysis is certainly used and its sophistication is generally directly proportional to the size of the breweries operations. Large breweries with dedicated QA departments have sensory panels that are trained and regularly tested against dosed samples to determine their threshold levels. Sensory training takes years. There are companies entirely devoted to conducting sensory analysis for the brewing/distilling industry.
A nano brewer (one or two man operation) might look at a Brulosophy experiment with some interest but when you get in the 10bbl+ size brewery there is little applicability and at the large scale breweries with multi-state distribution, no applicability at all.
 
I think you guys are trying to apply your personal expertise and interest in statistics and language to use Brulosophy in an effort to prove points which weren't intended or expected...
If it isn't intended or expected that people would try to interpret the results of a triangle test in the way triangle tests are interpreted why bother to follow some parts of the prescription for a triangle testing while ignoring others and why tell people that you are using triangle testing? It would be more intellectually honest to just describe what you are doing and give your results. But if you say we did a triangle test and here's our conclusion and the confidence level readers are going to assume that you followed a recognized protocol and have some expectation that your results are at least as reliable as the protocol allows. And people are going to look at your result in that light. When people find that the investigators really didn't follow a triangle protocol and that they apparently do not understand what a triangle test really is, when it applies, what its limitations are and how to conduct one it raises questions as to what the data really mean, if anything. When the investigators, or, really, their fans, come back and say "Well you never should have tried to interpret these tests as triangle tests" the obvious response is "Well you never should have mislead me into thinking you were doing triangle tests".

That's harsh and implies that the data are worthless. But those of us with some personal expertise and interest in statistics are interested in any data and want to see if there is any value in these tests whatever name they are called by. And it seems there is. In several cases we have found some even though the experimenters may not have been aware that it was there. And in ranting on about what we found and how we found it we can point to some things the experimenters could do to bring their procedures around to following more closely to a standard such as the oft mentioned ASTM E1885. At the same time we hope to educate the experimenters to the point where they are more likely to spend their test time effectively.

The most recently posted experiment is an interesting example:

My Impressions: These beers were much more difficult to discern than I imagined they&#8217;d be. Over multiple triangle test attempts, I pick the odd beer out and certainly lacked confidence in my choices.
Now if he done these taste tests before he empaneled his tasters he would have known from the difficulty in his ability to confidently detect the difference that the signal was weak i.e. that the beers are not very different; that Pd is small. His test results eventually suggested that it is about 0.05 though it could have been (95% confidence) between 0 and 0.3. Barely being able to taste the difference says it is much closer to 0 than 0.3. Had he looked at the ASTM prescription (as I have recommended over and over) he would have seen no panel size less than 39 for Pd = 20 at any tabulated level of confidence (the table is for confidence levels <0.2 for both alpha and beta) and would have known that a test with a panel of 22 members was not likely to give him a 'statistically significant' answer for signals < 0.2 which is where his pretasting strongly suggests he lies.

In order to reach statistical significance at this sample size, 12 tasters (p<0.05) would have had to correctly identify the unique sample, though only 8 (p=0.46) did, indicating participants in this xBmt were unable to reliably distinguish a lager made Pale malt from one made with Pilsner malt.
This is only half the story. What is the confidence, based on these data, that fewer than 20% of tasters will be able to detect the apparently small difference? It is p = 0.12. That's not as strong as we would like but suggests that one may very well be able to get away with using whichever malt he has on hand without his 'customers' noticing the difference. I think that's significant.

It was noted in another post that the main man is reading this thread. Despite that in this most recent test the practice of presenting 2 of one of the beers and one of the others persists. This is a violation of the protocol and something that is easy to change. We wonder why they persist in doing this. Perhaps in a desire to be consistent if wrong or perhaps they just don't care.

The earlier comments may seem like statistical gobbledy-**** and readers may think one needs a PHD in statistics to carry out a triangle test. That's not so. The procedure isn't written for PHD's in statistics. It's written for guys in bakeries, breweries, bottling plants, pharmaceutical labs etc. Get it, read it, follow it and you are doing triangle tests. I think it's a pity the Brulosophers don't choose to do that but then my job is to show them what they can do; not tell them what they should do.
 
Status
Not open for further replies.
Back
Top