Columbus Ohio water profile?

Homebrew Talk - Beer, Wine, Mead, & Cider Brewing Discussion Forum

Help Support Homebrew Talk - Beer, Wine, Mead, & Cider Brewing Discussion Forum:

This site may earn a commission from merchant affiliate links, including eBay, Amazon, and others.

unclekeg

New Member
Joined
Sep 28, 2008
Messages
4
Reaction score
0
Location
Springfield
Didn't know if someone had this available by chance?
I've got my all grain set up ready to go for the first go round. Unfortunately I haven't done my homework as far as my water is concerned. As you can imagine I'm chomping at the bit to get started with all grain brewing.
Am I better off building my water from RO?
Or trying to adjust the water from my tap?
Is there a way to get brewing off the bat while I figure all this out?:confused:
Thanks for putting up with all the questions!
 
Not sure if this is too late, but you can probably go ahead and brew with what you have. Of course filter for chlorine if you smell or taste any. I wouldn't let it sto pme from brewing is what I'm saying.

at your next convenience go to the city offices or look online (they may have it posted) for a city water report. Or have a Ward labs analysis done. You can then better adjust your water for the particular style you are brewing.
 
Public Utilities Homepage
http://utilities.columbus.gov/Water/PDFs/CCR2008.pdf

Looks like the pdf does not include all the mineral content that we brewers care about. Also you have three different water plants serving different areas of Columbus. I think the most important part of that water report to you is this:

http://utilities.columbus.gov/Water/PDFs/CCR2008.pdf said:
For additional information or questions about Columbus water quality please call the Water Quality Assurance Lab at (614) 645-7691

On a side note -- how hard is it to type "<your city> water report" into google?
 
You can always reverse osmosis our water or get bottled for less than $.32 a gallon at kroger or walmart, too.

I personally think columbus water smells like it was filtered through a horses ass.
 
This is an old thread, but if you call that number they will give it to you based on your water pump. She also told me to make some good beer :)

Here is what I got for the Dublin Rd plant:

Ca 38
Mg 6
Na 60
HCO3 75
SO4 128
Cl 96
 
Here's the most recent data for those served by the Hap Cremean plant (which provides water through most of the north and east sides of town).

Ca 31
Mg 10
HCO3 34
SO4 59
Na 15
Cl 25

Also, total hardness = 118

What odd water we have here. Very low in bicarbonates, low in mostly everything else, too. Looks like I'm good for brewing light beers. Happy brewing, kids!
 
Am I better off building my water from RO?
Or trying to adjust the water from my tap?
That depends on the style of the beer and what's in your tap water.
Is there a way to get brewing off the bat while I figure all this out?

Yes, that's what the Water Primer in the Stickies area is for.
 
EDIT: Here is the profile I got 3 years ago.
ColumbusWater1.jpg


I keep meaning to get a new profile, but if you call the water department and ask for one they will give you a detailed report based on your service plant. I think it took less than 24 hours when I got one about 3 years ago.
 
I keep meaning to get a new profile, but if you call the water department and ask for one they will give you a detailed report based on your service plant. I think it took less than 24 hours when I got one about 3 years ago.

I talked to the plant today, and the guy said the water has changed very little over the past few years. The above data, and your old data, ought to be accurate still.

So to make sure I'm reading this right, what would you water experts say this profile if best for, left untreated? It's basically low in everything except sulfates.
 
Just called today and what they gave me is very close to Guld.
All the data below is for Hap Creaman in mg/L which is almost identical to ppm. Like the comments from others, he did state it doesntchange much from year to year. He did mention the Na levels were down from lack of salt in runoff from being applied to he roads as of recent.

Ca 32
Mg 8
Na 16.3
Cl 30
SO4 60.3
Alkalinity as CaCO3 27 (~33 as HCO3)
Ph 7.8
Non-carbonate hardness as 81 and total hardness at 108
 
Beesy,
Any idea why the SO4 you have listed is half that of the posts above? The large table above has some variations but none that low.
 
Beesy,
Any idea why the SO4 you have listed is half that of the posts above? The large table above has some variations but none that low.

Yep, you are looking at the dublin road plant numbers, not the hap cremean numbers - look at guld's post for hap cremean comparison. Both my condo and your house are served by hap cremean.
 
Noob question here. So you guys are posting those numbers...what do they mean exactly? Not to get into a huge amount of detail, but is this water "acceptable" for brewing or do you think it would lead to off flavors?

I've had some strange flavors and mouthfeel from my past extract brews (not bad, but noticeably different than commercial brews). I'm 95% sure that it is a combination of fermenting too high (72-75 degrees, sometimes higher) and not hitting my FG (I had never even heard of a yeast starter until the batch that I just bottled a couple days ago).

I was wondering what kind of flavor differences you think using exclusively tap water with this profile would give.
 
It be awesome if ajdelange chimed in here. I believe it is pretty low in all those minerals with perhaps the SO4 (sulfate). So it is fairly soft, I think. Its definately suitable for brewing. You'll want to filter it or use a campden tablet to remove chlorine and/or chloramine. Mash ph is probably more important though. I just got a ph meter and am gonna monitor my water and mash ph from here on out. I would like to use ajdelange's primer to make base water, and dilute with RO water.
 
Here is the Ward Labs report from October 2011, source is Haps Cremean Plant:

pH 7.7
Total Dissolved Solids (TDS) Est, ppm 167
Electrical Conductivity, mmho/cm 0.28
Cations / Anions, me/L 2.6 / 2.3

The following are reported in ppm:
Sodium, Na 13
Potassium, K 4
Calcium, Ca 29
Magnesium, Mg 7
Total Hardness, CaCO3 102
Nitrate, NO3-N 0.4
Sulfate, SO4-S 17 (SO4 51)
Chloride, Cl 21
Carbonate, CO3 < 1
Bicarbonate, HCO3 38
Total Alkalinity, CaCO3 31
Total Phosphorus, P 3.62
Total Iron, Fe < 0.01
 
Quick Update:
I just called the water lab and got the most recent detailed numbers (2012) for the Hap Cremean plant

Total Alkalinity 30
Hardness 99
Ca 28
Mg 8
Na 12.7
Sulfate 58.6
Cl 24

Potassium 4.9
 
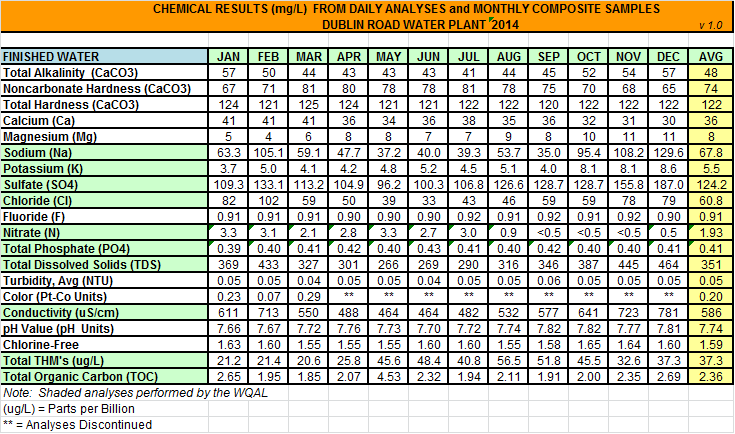
Here are the averages from the Dublin Road Plant based on 2014 (latest available at this point):

Calcium 36
Magnesium 8
Sodium 68
Chloride 61
Sulfate 124
Alkalinity 48

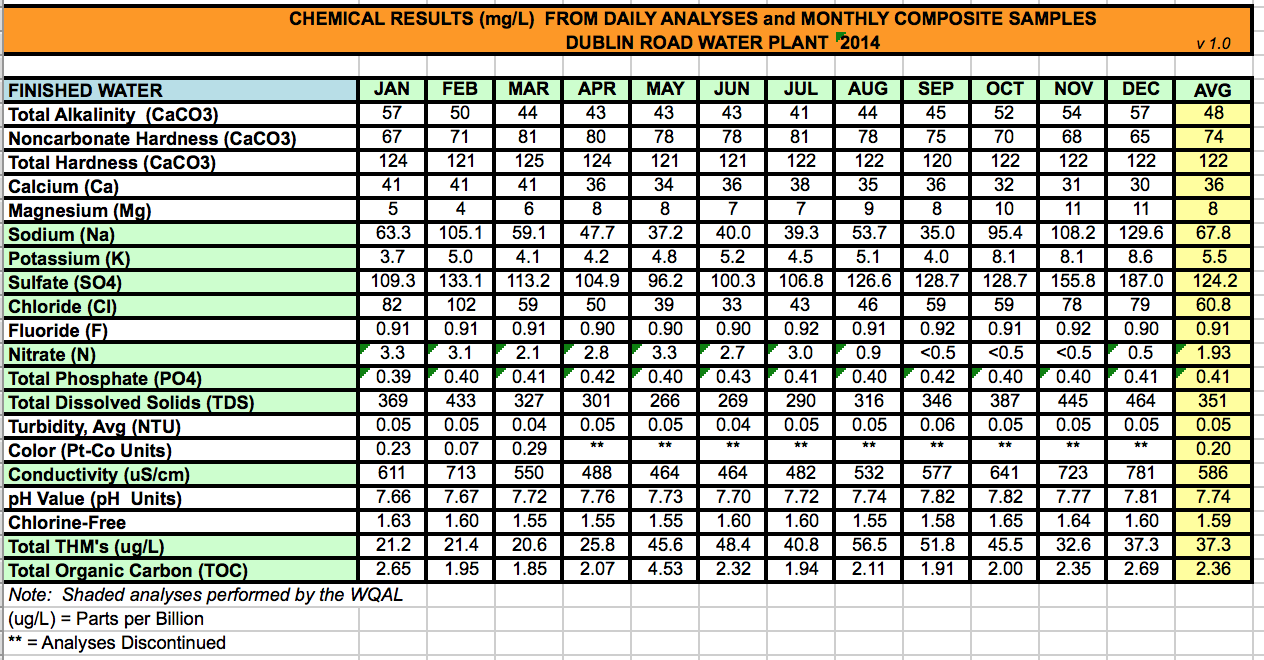
Unfortunately, the sodium, sulfate, and chloride numbers suffer HUGE swings from month to month (deltas of 50ppm or more throughout the year) so it's hard to dial anything in without on-the-spot measurements here. I have included the full report just in case.

I made a water profile in Brewer's Friend Water Chemistry Calculator as well:
http://www.brewersfriend.com/mash-chemistry-and-brewing-water-calculator/?id=LRHMT8H

Columbus OH Dublin Rd Plant Water Report (2014).png
 
Unfortunately, the sodium, sulfate, and chloride numbers suffer HUGE swings from month to month (deltas of 50ppm or more throughout the year) so it's hard to dial anything in without on-the-spot measurements here.

The measurements peak during the winter months. The increase is due to road salting. Its typical for many surface water sources in the north.
 
That makes a lot of sense, thanks for help. I may go by the month by month readings rather than the average.
 
The measurements peak during the winter months. The increase is due to road salting. Its typical for many surface water sources in the north.

That certainly used to be the case but governments have become much more sensitive to this and whereas one used to see piles of salt in road maintenance yards in the past one now typically sees those things that look like beehives with the salt piles inside. This keeps rain from washing salt into/onto the area near the maintenance yards and has, apparently cut down on the amount of NaCl making it into the environment from that source.

So lets see what the data in #6 tell us. The upper array of numbers are the correlation coefficients for the monthly data in the table. The data in Mjn are the months from June. For example, for May Mjn = 2 as it does for August. Low Mjn numbers represent warm weather months and higher numbers represent cold weather months. Reading across the first (Mjn) row we see that sodium (0.8296) and chloride (0.8509) are both strongly correlated with months from summer but alkalinity is even more so at 0.9210 and sulfate (0.7797) slightly less so. Potassium, Calcium and Magnesium are not strongly tied to (correlated with) the months from June but they are highly predictable from the straight month of the year. This can be seen from reading across the bottom line (Mo = straight month numbers: Jan =1, Feb = 2...) where we note that potassium and magnesium are strongly correlated with how far into the year we are but that calcium is strongly anti-correlated (less calcium in the fall than in the spring).

The numbers in the bottom table are measures of the quality of the correlations in the top table. For example at the intersection of calcium and chloride in the upper table we see a weak correlation (0.1587) between those two ions. In that bottom table we see, at that same intersection, the number 0.3156. This is the probability that we would see a correlation as high or higher than 0.1587 if calcium and chloride were in fact not correlated. A probability as high as 1/3 (one chance in 3) isn't very convincing and we accept that there may be no relationship between the calcium and chloride. The county apparently isn't using calcium chloride for road deicing. We have much more confidence in the correlation between sodium and chloride where r =0.7579 and the probability that they are uncorrelated is only 0.15%. The county could be using sodium chloride but correlation doesn't prove causation and they probably aren't using sodium bicarbonate which is supported by r = 0.8086 and only an 0.04% chance that those ions are in fact independent. Nor are they probably using sodium sulfate.

This exercise was kind of fun and suggests several hypotheses. There could be a common explanation for the increases in Na, Cl, SO4 and Alkalinity or there could be separate ones (road salting for Na and Cl and something else for alkalinity and sulfate) etc.

Untitled 3.jpg
 
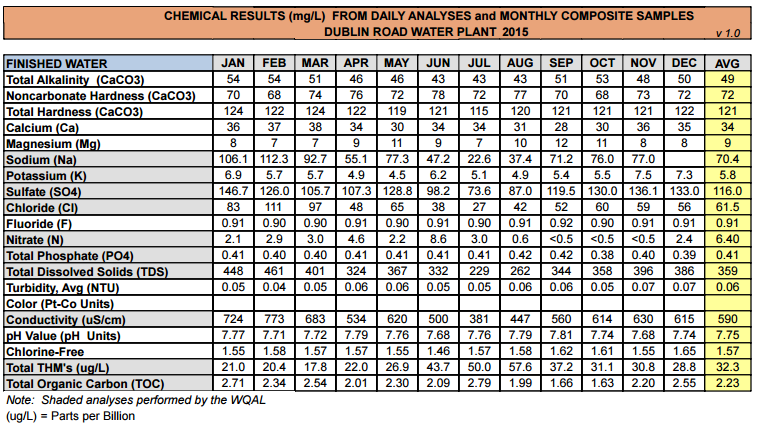
I was able to get the almost completed 2015 profile from the Dublin Rd plant as well (just missing Na for December). Hope this helps.

Calcium 34
Magnesium 9
Sodium 70.4
Chloride 61.5
Sulfate 116
Alkalinity 49
pH 7.75

Overall, pretty similar to 2014 so we are dealing with a pretty stable source.

See attachments for full report and the appropriate BeerSmith water profile.

As a side note (for anyone looking for more detail) the majority of Columbus City Water is surface water retrieved from the Scioto River and Big Walnut Creek as well as a bit of groundwater from an "unconfined" (not covered by layers of clay) sand/gravel aquifer located in the Scioto River Valley. Columbus City Water is treated with Chlorine (1.51 ppm avg.) rather than Chloramine, which is beneficial for brewing given the ease of removal vs its counterpart. Check out this great link on the many ways to remove it and pros/cons of each: http://homebrew.stackexchange.com/q...-to-remove-chlorine-chloramine-from-tap-water

View attachment DRWP_Tap2015 ANO2.pdf

2015_Water_Profile.PNG


View attachment Columbus_Ohio_Water.bsmx
 
Are you guys getting these direct from the plants, or from somewhere else? Anyone have one of these fancy charts for Hap Cremean?
 
Are you guys getting these direct from the plants, or from somewhere else? Anyone have one of these fancy charts for Hap Cremean?

These numbers are coming direct from the City of Columbus Water Quality Assurance Lab. You can get some basic info online (see link below), but if you want the numbers that matter to brewers, call in for the full report at the lab (614-645-7691) . The previous posts are specific to the Dublin Rd Facility that services the majority of the Columbus area and west side.

http://www.ci.reynoldsburg.oh.us/Uploads/Documents/departments/water/2014 Water Quality Report.pdf
 
Hap Cremean water plant, March 2016:

mg/L
calcium 29.3
magnesium 7.8
sodium 14.3
potassium 4.6
bicarbonate 30.0
sulfate 51.0
chloride 32.0
nitrate 1.0
 
I'm served by Hap Cremean (Upper Arlington) and just got these results:

pH 7.8
Total Dissolved Solids (TDS) Est, ppm 281

ppm
Sodium, Na 49
Calcium, Ca 34
Magnesium, Mg 10
Total Hardness, CaCO3 127
Sulfate, SO4-S 39
Chloride, Cl 41
Carbonate, CO3 < 1.0
Bicarbonate, HCO3 60
Total Alkalinity, CaCO3 50
 
Back
Top