<html>
<head>
<meta http-equiv="refresh" content="30">
<script type="text/javascript" src="https://www.google.com/jsapi"></script>
<script type="text/javascript">
google.load("visualization", "1", {packages:["corechart"]});
google.setOnLoadCallback(drawChart);
function drawChart() {
var data = new google.visualization.DataTable();
data.addColumn('string', 'Time');
data.addColumn('number', 'Temp');
data.addColumn('number', 'Input');
data.addColumn('number', 'Setpoint');
data.addRows([
<?php
error_reporting(E_ERROR);
$db="HLT";
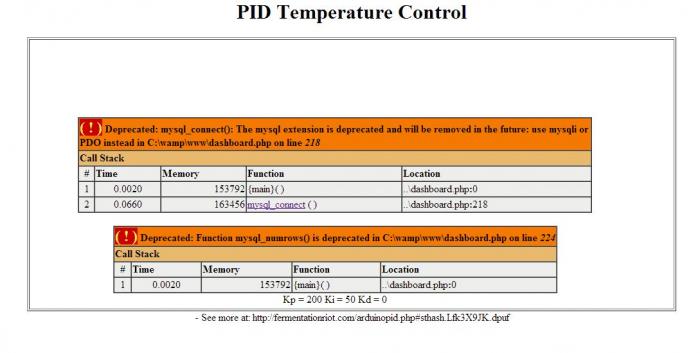
$link = mysql_connect('', 'jakwi', 'password');
mysql_query('SET NAMES utf8');
mysql_select_db($db , $link) or die("line 21 Couldn't open $db: ".mysql_error());
// Retrieve all the data from the "example" table
$result = mysql_query("SELECT TIMESTAMPDIFF(MINUTE,FROM_UNIXTIME(Time), now()) as Time1, Temp, Setpoint, Input FROM temp WHERE TIMESTAMPDIFF(MINUTE,FROM_UNIXTIME(Time), now()) < 120 Order By Time");
if ($result !== false) {
$num=mysql_numrows($result);
$i=0;
echo"";
while ($i < $num) {
$time=mysql_result($result,$i,"Time1");
$temp=mysql_result($result,$i,"Temp");
$input=mysql_result($result,$i,"Input");
$setpoint=mysql_result($result,$i,"Setpoint");
echo "['";
echo "$time";
echo "',";
echo "$temp";
echo ",";
echo "$input";
echo ",";
echo "$setpoint";
echo "]";
if ($i < ($num - 1))
{
echo ",";
}
$i++;
}
}
?>
]);
var options = {
width: 1000, height: 300,
hAxis: {title: 'Minutes Ago'},
vAxis: {title: 'Temperature F', maxValue: 100, minValue: 40}
};
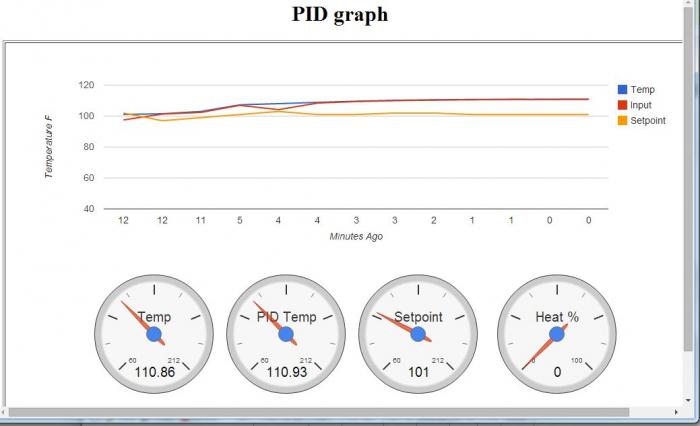
var chart = new google.visualization.LineChart(document.getElementById('chart_div1'));
chart.draw(data, options);
}
</script>
<script type='text/javascript' src='https://www.google.com/jsapi'></script>
<script type='text/javascript'>
google.load('visualization', '1', {packages:['gauge']});
google.setOnLoadCallback(drawChart);
function drawChart() {
var data = new google.visualization.DataTable();
data.addColumn('string', 'Label');
data.addColumn('number', 'Value');
data.addRows([
<?php
error_reporting(E_ERROR);
$db="HLT";
$link = mysql_connect('', 'jakwi', 'password');
mysql_query('SET NAMES utf8');
mysql_select_db($db , $link) or die("line 88 Couldn't open $db: ".mysql_error());
// Retrieve all the data from the "example" table
$result = mysql_query("SELECT Time, Temp, Setpoint, Input, Kp, Ki, Kd FROM temp Order By Time desc limit 1");
if ($result !== false) {
$num=mysql_numrows($result);
$time=mysql_result($result,0,"Time");
$temp=mysql_result($result,0,"Temp");
$input=mysql_result($result,0,"Input");
$setpoint=mysql_result($result,0,"Setpoint");
$ki=mysql_result($result,0,"Ki");
$kp=mysql_result($result,0,"Kp");
$kd=mysql_result($result,0,"Kd");
echo "['Temp',";
echo "$temp";
echo "],";
echo "['PID Temp',";
echo "$input";
echo "],";
echo "['Setpoint',";
echo "$setpoint";
echo "]";
}
?>
]);
var options2 = {
width: 600, height: 300,
minorTicks: 2, max: 212, min: 60
};
var chart = new google.visualization.Gauge(document.getElementById('chart_div2'));
chart.draw(data, options2);
}
</script>
<script type='text/javascript' src='https://www.google.com/jsapi'></script>
<script type='text/javascript'>
google.load('visualization', '1', {packages:['gauge']});
google.setOnLoadCallback(drawChart);
function drawChart() {
var data = new google.visualization.DataTable();
data.addColumn('string', 'Label');
data.addColumn('number', 'Value');
data.addRows([
<?php
error_reporting(E_ERROR);
$db="HLT";
$link = mysql_connect('', 'jakwi', 'password');
mysql_query('SET NAMES utf8');
mysql_select_db($db , $link) or die("line 139 Couldn't open $db: ".mysql_error());
// Retrieve all the data from the "example" table
$result = mysql_query("SELECT Time, Heat FROM temp Order By Time desc limit 1");
if ($result !== false) {
$num=mysql_numrows($result);
$heat=mysql_result($result,0,"Heat");
echo "['Heat %',";
echo "$heat";
echo "]";
}
?>
]);
var options3 = {
width: 200, height: 300,
minorTicks: 2, max: 100, min: 0
};
var chart = new google.visualization.Gauge(document.getElementById('chart_div3'));
chart.draw(data, options3);
}
</script>
</head>
<body>
<div align="center">
<H1 align="center">PID graph</H1>
<div align="center">
<table width="900" border="1">
<tr>
<td><div align="center">
<table width="1000" border="0">
<tr>
<td width="141"> </td>
<td width="10"> </td>
<td width="432"><div id="chart_div1"></div></td>
<td width="141"> </td>
<td width="144"> </td>
</tr>
<tr>
<td> </td>
<td> </td>
<td> </td>
<td> </td>
<td> </td>
</tr>
<tr>
<td> </td>
<td> </td>
<td>
<div align="center">
<table width="800" border="0">
<tr>
<td width="595"><div id="chart_div2"></div></td>
<td width="195"><div id="chart_div3"></div></td>
</tr>
</table>
</div></td>
<td> </td>
<td> </td>
</tr>
<tr>
<td> </td>
<td> </td>
<td> </td>
<td> </td>
<td> </td>
</tr>
<tr>
<td> </td>
<td> </td>
<td><div align="center">
<?php
error_reporting(E_ERROR);
$db="HLT";
$link = mysql_connect('', 'jakwi', 'password');
mysql_query('SET NAMES utf8');
mysql_select_db($db , $link) or die("line 220 Couldn't open $db: ".mysql_error());
// Retrieve all the data from the "example" table
$result = mysql_query("SELECT Time, Temp, Setpoint, Input, Kd, Ki, Kp, Heat FROM temp Order By Time desc limit 1");
if ($result !== false) {
$num=mysql_numrows($result);
$time=mysql_result($result,0,"Time");
$temp=mysql_result($result,0,"Temp");
$input=mysql_result($result,0,"Input");
$setpoint=mysql_result($result,0,"Setpoint");
$ki=mysql_result($result,0,"Ki");
$kp=mysql_result($result,0,"Kp");
$kd=mysql_result($result,0,"Kd");
$heat=mysql_result($result,0,"Heat");
echo "Kp = ";
echo $kp;
echo " Ki = ";
echo $ki;
echo " Kd = ";
echo $kd;
}
?>
</div></td>
<td> </td>
<td> </td>
</tr>
</table>
</div></td>
</tr>
</table>
</div>
</body>
</html>
- See more at: http://fermentationriot.com/arduinopid.php#sthash.mvNXxNUz.dpuf


