I think that's the '64-bit question.' I'm on Lion, and found out that I can no longer run my versions of Photoshop and Illustrator. So, now I'm on Gimp and Inscape--open source software. You might want to see what
OpenOffice can do...
I'm 46 now, and have collected a nice little science, engineering, and machine garage-lab--all previously owned equipment. There are a lot of guys like us, once we've settled down, who do the same. It's genuine interest like yours that gets us here. Also don't overlook your university's facilities, and your major study of interest, these are your formative years...
The fun here is that we're all amateurs for the most part, we do this stuff because we love it, and some of us even play well with others. It's fun figuring things out as a group and not worry about getting paid, as an exercise in Science, it keeps our minds occupied and out of trouble. It's always encouraging to see younger ones like us--your enthusiasm is contagious.
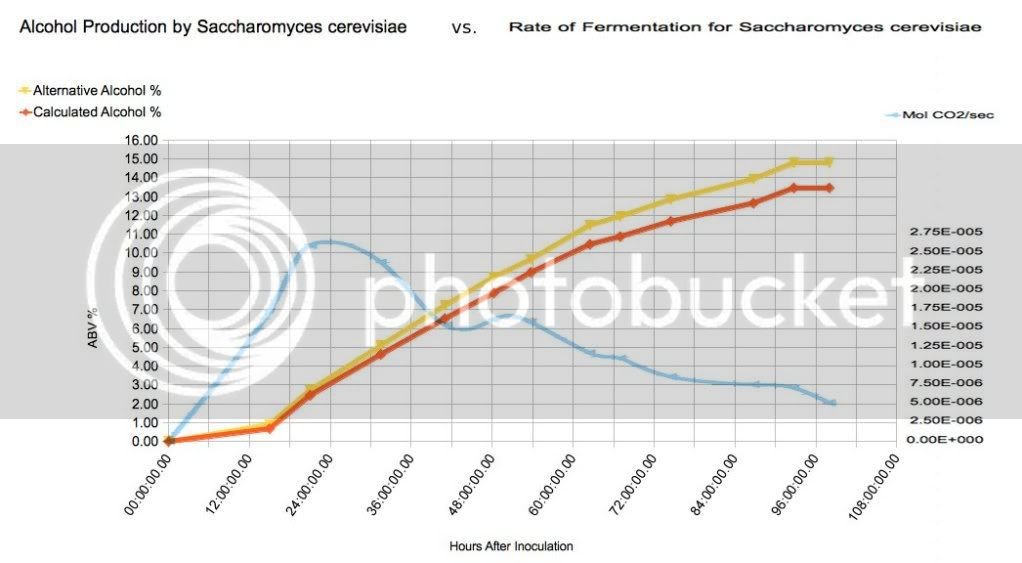
I think measuring CO2 in the yeast/sugar/alcohol/CO2, metabolic reaction, actually has the potential to be more accurate as ajdelange stated--you just haven't nailed down the method to measure it better than the hydrometer. For example, I would think about some form of degassing process that will help calculate CO2 in solution. You could test that, and create a fudge-factor, figured by temperature. It would only be relevant at the beginning of the process, until the solution became saturated, but you may be surprised that it changes during the process. Then I would try to calculate how much CO2 is ionized into Carbonic acid and bicarbonates, and this might be as simple as taking pH and
TDS data. Also might be interesting how much Carbon is retained in the cells of multiplying yeast, that might become significant as your accuracy increases.
Here's the CO2 wiki.
Here's a saltwater reef tank article.

") to gauge moles of CO2 by mass in a closed grow chamber--surprisingly heavy. Mylar is not as porous as rubber, and with mylar there would be no pressure increase in your closed system, both attributes would improve the experiment's accuracy.
to gauge moles of CO2 by mass in a closed grow chamber--surprisingly heavy. Mylar is not as porous as rubber, and with mylar there would be no pressure increase in your closed system, both attributes would improve the experiment's accuracy.


![Craft A Brew - Safale S-04 Dry Yeast - Fermentis - English Ale Dry Yeast - For English and American Ales and Hard Apple Ciders - Ingredients for Home Brewing - Beer Making Supplies - [1 Pack]](https://m.media-amazon.com/images/I/41fVGNh6JfL._SL500_.jpg)