Interpretation of City Water Quality Report

Homebrew Talk - Beer, Wine, Mead, & Cider Brewing Discussion Forum

Help Support Homebrew Talk - Beer, Wine, Mead, & Cider Brewing Discussion Forum:

This site may earn a commission from merchant affiliate links, including eBay, Amazon, and others.

ognam

Member
Joined
Apr 27, 2009
Messages
20
Reaction score
0
I live in Elgin, IL and the city posts a nice Water Quality report which contains (I think) everything I need to know, but I need some help to interpret (as I am no chemist).

The actual report is at: City of Elgin, Illinois - Official Website - Water Quality

Total Alkalinity - 79, pH - 8.72
---Hardness (all mg/L as CaCO3)
Total Hardness - 127
Calcium Hardness - 83
Magnesium Hardness - 42
Non-carbonate Hardness - 46

I think to get to ppm ion concentrations for Ca and Mg, I would figure the molar weight to be 40/100 (for Ca) and 24.3/100 (for Mg), or 33.3 and 10.2 respectively.

All the other important data (except bicarbonate ppm) is also in the report I think:
Ca - 33.3
Mg - 10.2
Na - 43
Cl - 112.9
SO4 - 49.8
HCO3 - ??
CO3 - ??
CaCO3 - ??

My question is this: Can I calculate the bicarbonate and carbonate levels using Total Alkalinity and pH similar to this link: HOW TO CALCULATE BICARBONATE, CARBONATE AND HYDROXIDE FROM TOTAL ALKALINITY

If so, I get HCO3 of ~92 and CO3 of ~2. What is CaCO3?

All of this data seems to jive until I plug it into Bru'N Water spreadsheet. The cations and anions are not in mass balance (there are way more anions). So it leads me to believe I am missing something.

Can anyone help me with interpretation? I like the setup of Bru'N Water's spreadsheet, but want to make sure my baseline assumptions are correct.

Also, I am planning to purchase a pH meter to validate my results, but since I already have access to this data, I want to use it as a starting point.
 
Total Alkalinity - 79, pH - 8.72
---Hardness (all mg/L as CaCO3)
Total Hardness - 127
Calcium Hardness - 83
Magnesium Hardness - 42
Non-carbonate Hardness - 46

When the term "hardness" is used it means "as Calcium Carbonate". If you put 100 mg calcium carbonate (1 millimole) in 1 L of water and bubble carbon dioxide through it until it is all dissolved and the pH brought to a reasonable value you will have alkalinity of 100 ppm as CaCO3 and the calcium hardness will be 100 ppm as CaCO3. The water will contain 1 millimole of calcium and 2 mmol of bicarbonate (one from the limestone and one from the CO2) but as calcium is doubly charged you will have 2 milliEquivalents of each. Thus 50 ppm as CaCO3 is 1 mEq/L

I think to get to ppm ion concentrations for Ca and Mg, I would figure the molar weight to be 40/100 (for Ca) and 24.3/100 (for Mg), or 33.3 and 10.2 respectively.

Given the above Ca++ at 83 ppm as CaCO3 is 83/50 = 1.66 mEq/L. The equivalent weight of calcium is 20 (half the atomic weight) so the calcium concentration is 1.66*20 = 33.2 mg/L. Magnesium harndess of 42 implies 42/50 = 0.84 mEq/L. The equivalent weight of magnesium is 12.15 so the magnesium concentration is 10.2

All the other important data (except bicarbonate ppm) is also in the report I think:
Ca - 33.3
Mg - 10.2

As we just calculated.


My question is this: Can I calculate the bicarbonate and carbonate levels using Total Alkalinity and pH similar to this link: HOW TO CALCULATE BICARBONATE, CARBONATE AND HYDROXIDE FROM TOTAL ALKALINITY

If so, I get HCO3 of ~92 and CO3 of ~2.

I'll say yes but not too enthusiastically because you got the "wrong" answer but not by that much. For your water (pH 8.79, alkalinity 79) you would have bicarbonate at 88.6 and carbonate at 2.5 mg/L. This assumes a couple of things. First, that the alkalinity was measured at 20 °C and that the analyst titrated to pH 4.3. If he did the analysis at 25 °C and titrated to the equivalence end point, pH 4.58, as some labs do (they are supposed to tell you what end point they used but I've never seen one do it) then the bicarbonate would be 90.3 and the carbonate 2.8. When pH is less than 8.3 lots of brewers take the alkalinity and divide by 50 (to get the equivalence of bicarbonate because at pH < 8.3 most of the carbo species are bicarbonate) and then multiply by the equivalent weight of bicarbonate which is 61. This would give you 96.38. Though most people don't think about it water itself has a small alkalinity of about 2.5 ppm as CaCO3. Subtracting this from the total alkalinity gives a slightly better answer: 93. This isn't too terrible an estimate. Even though your pH is above 8.3 the error is comparable to that resulting from uncertainty WRT what the lab did when it measured alkalinity. More on this in a minute.


What is CaCO3?

Limestone, chalk, aragonite, vaterite, calcite. It is the mineral which puts all the calcium and half the bicarbonate in the waters we deal with. There is often confusion about it because of the water industry's practice of expressing calcium harndess, magensium hardness and alkalinity all "as CaCO3". In fact there is very little carbonate in any water with pH < 8.3.

All of this data seems to jive until I plug it into Bru'N Water spreadsheet. The cations and anions are not in mass balance (there are way more anions). So it leads me to believe I am missing something.

Yes, the imbalance is over 1.4 mEq/L. What you are missing are the concentrations of the ions that are not reported (F,Al,Fe,Mn,Cu, NH4, NO2, NO3, K...) but these won't amount to anything near 1.4 mEq/L unless you have potassium at > 40 mg/L or some equally absurd level. Rather than unreported ions the problem is how they are reported. The numbers you have, if they came from an analysis of a single sample, would come closer to balancing but water authorities have elaborate protocols for sampling and measuring one parameter on Tuesdays and Fridays and another on Mondays and Wednesdays (for example) and the numbers you are given are often weekly, monthly or seasonal averages.

Can anyone help me with interpretation?

If you want details on a more robust bicarbonate calculation I can give you that - just post again.

20.0Also, I am planning to purchase a pH meter to validate my results, but since I already have access to this data, I want to use it as a starting point.

Getting a pH meter is an excellent idea and really the only way to control some of the vagaries. Also, using the data you have to get a general picture is an excellent idea but as we have seen here the data you have isn't very good - an imbalance of 1.4 mEq/L pretty much relegates this report to the trash. Best move for you at this point would be to send a sample off to Ward Labs. You'll get a report which generally balances to 0.3 mEq/L or so (and they put the imbalance in the report). That will serve as a much more realistic baseline but keep in mind that the large imbalance of the report you have suggests appreciable variation with season, drawing from multiple sources or some other cause.
 
Yes, the imbalance is over 1.4 mEq/L. What you are missing are the concentrations of the ions that are not reported (F,Al,Fe,Mn,Cu, NH4, NO2, NO3, K...) but these won't amount to anything near 1.4 mEq/L unless you have potassium at > 40 mg/L or some equally absurd level. Rather than unreported ions the problem is how they are reported. The numbers you have, if they came from an analysis of a single sample, would come closer to balancing but water authorities have elaborate protocols for sampling and measuring one parameter on Tuesdays and Fridays and another on Mondays and Wednesdays (for example) and the numbers you are given are often weekly, monthly or seasonal averages.

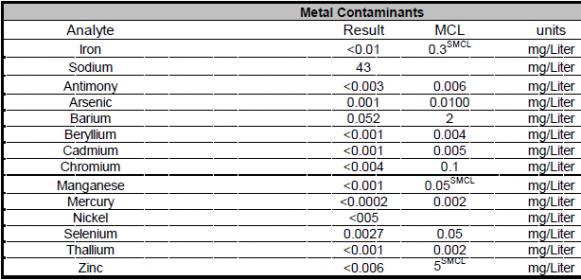
In looking at the report, most of those things are listed, but there's still a substantial imbalance... what does that mean? They are failing to report something that makes up 1.4 mEq/L? I guess I find that hard to believe. I have contacted the water director with a couple initial questions (to find out if this report applies to me), and she's very responsive. Is there something I can ask her that would shed more light on this?

Also, looking at the report, indeed these are from many samples over a period of time. You're saying that this could explain the imbalance?

metal1.jpg


inorganic1.jpg
 
Also, looking at the report, indeed these are from many samples over a period of time. You're saying that this could explain the imbalance?

Yes. You are inserting the average values into the spreadsheet, apparently, and that's really the only reasonable thing to do. But you can't expect the result to balance. You might be tempted to think that as each analysis must balance the average would too but you aren't averaging complete analyses. They measured fluoride 376 times and nitrate only 62, for example.
 
The ionic balance of that profile is too far off to rely on. I agree with all the assumptions and conversions, but something is either miss-reported or we have made an incorrect assumption on its conversion to the raw mg/L format.

A discussion with the lab manager is a good way to go. When discussing the quantities, be sure to point out that your evaluation indicates that the cations and anions don't come very close to balancing and then list the ions and the mg/L concentrations you believe their water report provides. Maybe they can deduce which ion is mis-reported or mis-converted.

Sending a sample off to Ward might be easier. They tend to produce reports that come closer to balancing.
 

Latest posts

Back
Top