OK, perfect, thanks AJ. If we're talking what I know of as drift (?), I can already tell you from memory that I wasn't the happiest with the meter in that I felt I was constantly calibrating it during any cheesemaking day.
That suggests that it wasn't very stable.
Now, that may be an issue with the meter, or my neurotic perfectionism gone wild, can't recall. I'm sorry I don't know the term or have forgotten the term rms stability (slope?), but want to investigate it.
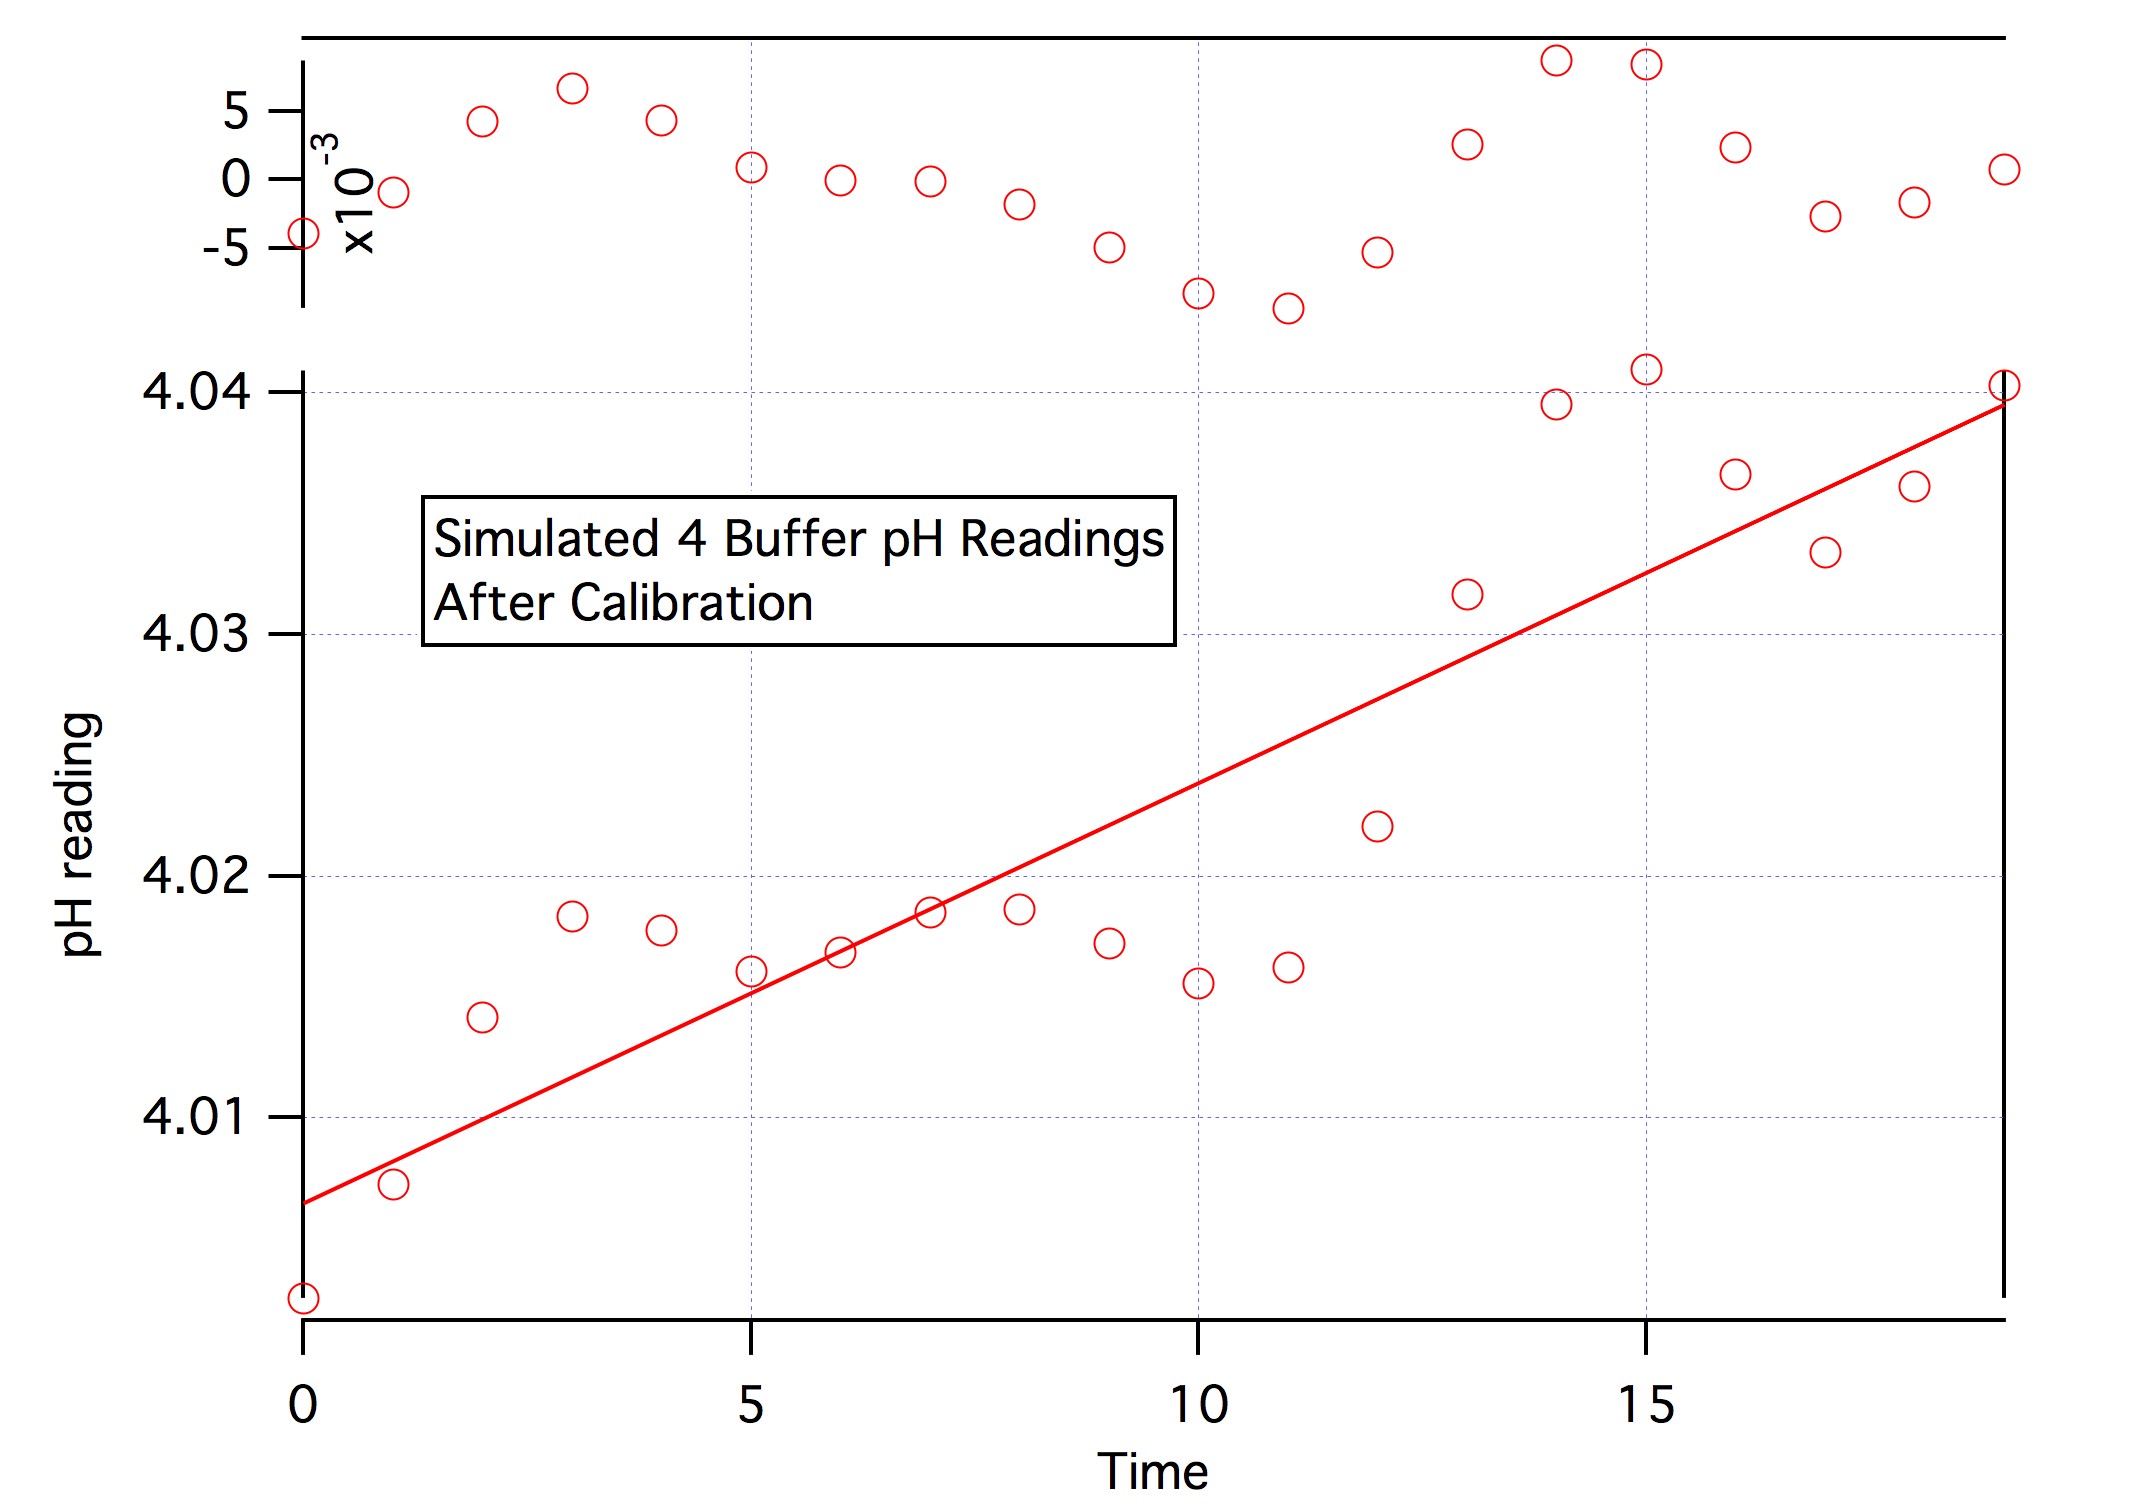
They say a picture is worth a thousand words so here's a picture of what a series of pH readings of the pH 4 buffer
might look post calibration. I emphasize "might" because this is phony data cooked up by me to illustrate the two types of error at play here.
The open circles in the bottom half represent pH readings taken one time unit apart after calibration. Calibration adjusts the gain and offset of the meter electronics to force it to read 4.00 when in 4 buffer. Thus we would expect, just after calibration, that it will read 4 or very close to it. Over time, though, the reading will wander off. The errors contain a noise like component (the open circles in the upper part of the graph) and a trend (represented by the straight sloped line). If there is no trend the actual readings will look like the upper trace. If there is a trend the actual readings are the sum of the upper trace errors plus the trend line.
RMS error is the 'root mean square' error computed by taking each of the errors, squaring it, adding to an accumulator which, after all errors have been considered, contains the sum of the squared errors. Now we divide this by the number of measurements which gives us the average squared error (mean square error) and finally we take the square root to get the root mean square error. This is sort of like and effective constant error magnitude (it can't be negative).
Finally, with respect to the earlier question as to how a stability test is interpreted we note that if the time units in the graph are hours we'd say we had a pretty good meter. Even though there is clearly some instability including a trend (drift) the expected readings stay within + 0.02 pH (not ± 0.02 note) for 12 hours. Most brewers would be happy with that level of accuracy over the course of a 12 hour brew day. OTOH if the time units are minutes the meter does not look so good. After 15 minutes it's off by + 0.04 an clearly drifting appreciably in a quarter of an hour. It is possible, of course, to use such a meter but we would want to recalibrate every 15 minutes or so.


