• Please visit and share your knowledge at our sister communities:
  • If you have not, please join our official Homebrewing Facebook Group!

    Homebrewing Facebook Group

A thought experiment to test the general validity of available mash pH software

Homebrew Talk

Help Support Homebrew Talk:

This site may earn a commission from merchant affiliate links, including eBay, Amazon, and others.
A.J., in row 77 both columns B and C result in very small 'Q Total' numbers, as is the goal, correct? And in both cases you ended up acidifying with the exact same quantity of Lactic Acid.
Yes, the goal is always to find the value of the sought after quantity which drives the sum of the ∆Q's as close to 0 as you can get it because in the real world the sum of the ∆Q's is 0. Now notice that ∑∆Q is larger in Col D than in the other two columns. But it is small enough. Solver is iterative. It will stop if it gets close enough to target any time but it will also stop after a certain number of iterations. If you arrive at a case with ∑∆Q larger than you are happy with just run it again. It then does another set of iterations starting where it left off last time and depending on the nature of the problem will usually find a solution resulting in a smaller residual.

The lactic acid is exactly the same in all three cases. The goal was to show where the pH falls with 12.5 lbs malt, 0 or 37.85 mEq Ca++, 4.362586103 mL lactic acid and 10 or 20 gal DI water.

As this is the case, then for the small differences in Total Q seen in row 77 for columns B and C, in reality once again we have a situation where the DI water to grist ratio is not changing the pH shifting effect by very much at all, only this time with regard to the fixed quantity of added calcium mineralization and the variable DI mash water quantity. Do you see this essentially as I do here?
Yes

If so, then (just as I have done for my pending Mash Made Easy version 1.60) most others will need to alter their mash pH predicting software accordingly, but the Kaiser Water Calculator is vindicated.
Are you noticing a trend here? Kai knows what he is doing. Too bad he doesn't contribute here any more. He used to.
 
Are you talking about the Kaiser Water excel spreadsheet? I still have a copy in my files and I’m going to review tonight.
 
AJ two things come to mind. Your latest spreadsheet example has additional rows that were not included in your previous spreadsheet post. Solver is something I learned how to use. I am able to replicate your previous spreadsheet results now.
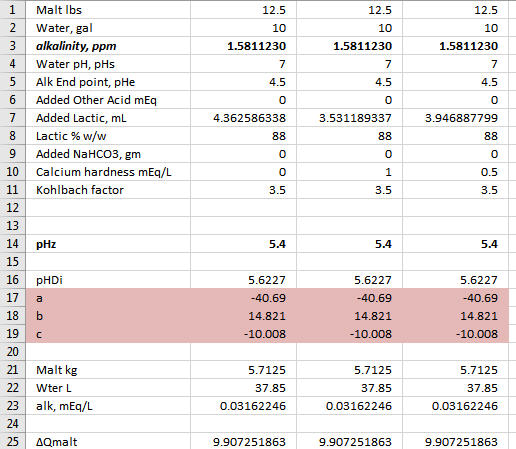
Hi @ajdelange how did you get the pHz values to change? Did you use solver for that too? Using your latest version with 0, 1.0 and 0.5 mEq/L of calcium hardness in columns B, C and D I can see the mL of lactic acid changes. But the pHz values are entered.

aj-3.jpg
 
Last edited:
A.J., I copied and used your latest spreadsheet to confirm that mineralization's effect upon the quantity of acid required to hit a mash pH of 5.4 does not change much when going from 1 mEq/L of Ca++ in 10 gallons to 0.5 mEq/L in 20 gallons, and to get near zero 'delta Q Total' in row 77 required that I add 3.53 mL of 88% lactic acid to the 10 gallon mash, and 3.542 mL to the 20 gallon mash. Not much difference, confirming that a doubling of the mash water does not change much with respect to the impact of a fixed quantity of minerals added to the mash.

3.542/3.53 = 1.0034
 
Yes! Version 1.58

I’m a trust but verify kind of guy. It’s the former nuclear power plant engineer me.

I see some volume based relationships for pH shift in the detailed calculations so I’ll have to square that before I’m on board with you guys.

I’d also like to play with AJs sheet and mine as well before I go changing my modded Riffe calcs around. I don’t doubt what you are saying but I have not had the time to crunch the numbers myself yet.
 
RPIScotty: I didn't use any of the inner workings of the Kaiser Water Calculator for Mash Made Easy.

PM me if you want to discuss my solution with regard to mineralization and its impact upon downward mash pH shift, but you are also welcome to download a copy of my new Mash Made Easy version 1.60 first. I just got it up and running on my website.

Oh. I thought you referenced the Kaiser Water sheet as what you use to confirm your results.

A lot of info flying around today and I’m not sure it’s all sunk in yet. I need to review the various sheets and see what’s up. My sheet does not have any of the acid issues that started this thread so I’m really just concerned now with getting to the bottom of how to model the shift induced by Ca and Mg.
 
Last edited:
Oh. I thought you referenced the Kaiser Water sheet as what you use to confirm your results.

I merely ran the Kaiser Calculator and noticed that (for all else being fixed and held constant sans of course for mineral ppm's) its mineral induced pH shift was not altered by changes to the mash water volume (even for large changes). It's the fixed quantity of added Ca and Mg mEq's that do the work, and not the variable ppm's for same as caused by water volume changes.

To borrow an old saying from oval track racing: I was so far behind Kai Troester on this one that I thought I was in the lead.

So let me see if I’m hearing this correctly: pH shift was unaltered by large swings in volume, but mineral concentrations went up and down accordingly?

That won’t fly in the real world though, right? If I want 50 ppm of Ca in my finished profile, I’ll have to vary the dose with volume and therefore the pH shift will change. You are holding the dose constant but not the concentration. Am I getting that much right?

Yes, and this is indeed a radical development. Now the age old adage that somewhere around 40 to 50 minimum ppm of calcium in the mash water will be found to be advantageous will need to be revised (for perfectionists at least) to some minimum quantity of Ca with regard to mEq's, and more than likely also in regard to the mEq's of Ca++ vs. grist weight, wherein a ratio of mEq's of calcium divided by Kg's of grist will replace the old 40-50 ppm of calcium standard. I haven't delved into this aspect of it yet though.
 
Yes, and this is indeed a radical development. Now the age old adage that somewhere around 40 to 50 minimum ppm of calcium in the mash water will be found to be advantageous will need to be revised (for perfectionists at least) to some minimum quantity of Ca with regard to mEq's, and more than likely also in regard to the mEq's of Ca++ vs. grist weight, wherein a ratio of mEq's of calcium divided by Kg's of grist will replace the old 40-50 ppm of calcium standard. I haven't delved into this aspect of it yet though.

Well not really. Even if it's effect on pH changes drastically, things like CaCl and Gypsum are mated with what most people would consider desirable flavor ions. Dosing of these minerals would likely stay exactly the same even in light of any effects on pH.

If that's the case, then dose won't stay constant in practical application and pH shift will not stay constant either. Even if you substitute MgSO4 for Gypsum to get Sulfate, you still be changing the pH shift with Magnesium. You could always supplement NaCl for CaCl but there are benefits to elevated levels of Calcium in brewing and you'd be replacing Ca with Na.

This is an interesting crossroads to be at, although I'm not quite sold on how groundbreaking it is quite yet. In fact, it changes very little about using Ca and Mg salts as tertiary reducers of pH.

EDIT: I just checked my modded version of the Riffe MpH calculator I posted earlier today and there is not a significant change in pH from mimicking what we have been discussing here. I guess this shouldn’t be surprising because Riffe leans heavily on Kai’s work for the sheet. Grain weight and CaCl dose held constant with 16, 20, 32, 64 and 128 l shows a negligable change in pH (0.01-0.07 pH units).
 
Last edited:
....If we simplify this, if I add 5ml of lactic to a liter of water, I am going to get a much different pH than I would if I added it to 10 liters.
I fill a 10 gallon container with RO water. After a few hours exposure to room air the pH falls from a theoretical 7.0 to ~4.8 without adding acid or salts. The lack of buffering in the RO water allows the weak carbonic acid in the air to lower its pH.

In theory adding lactic acid will drop the pH even lower since there’s no buffering to resist the acid. Does the RO water ever become saturated with lactic acid to the point where pH doesn’t drop any lower?
 
Hi @ajdelange how did you get the pHz values to change? Did you use solver for that too? Using your latest version with 0, 1.0 and 0.5 mEq/L of calcium hardness in columns B, C and D I can see the mL of lactic acid changes. But the pHz values are entered.

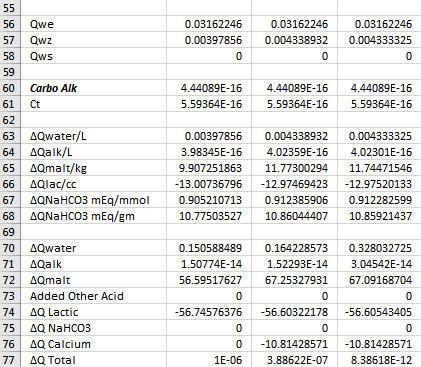
That's the beauty of Solver. You can ask it to set any cell to a particular value by varying any other cell or cells. In this eample we started (Column B) by asking solver to zero ∆Q Total by varying the amount of lactic acid after setting pHz to 5.4 in order to find out how much lactic acid we needed to get that pH with 12.5 lbs of this malt and 10 gal DI water. Having determined the amount of lactic acid required we then re-run (in Column C) with that same amount of lactic acid, malt and DI water but now we have added 1 mEq/L calcium hardness. As soon as we add in the calcium hardness ∆Q Total shifts because we are still at pH 5.4 but we know that in the real world ∆Q Total = 0 so this time we ask solver to set ∆Q Total to 0 by varying pHz and when it does this we have he value of pHz corresponding to the malt, acid and water quanties as before but with the 1 mEq/L hardness.
 
In theory adding lactic acid will drop the pH even lower since there’s no buffering to resist the acid. Does the RO water ever become saturated with lactic acid to the point where pH doesn’t drop any lower?
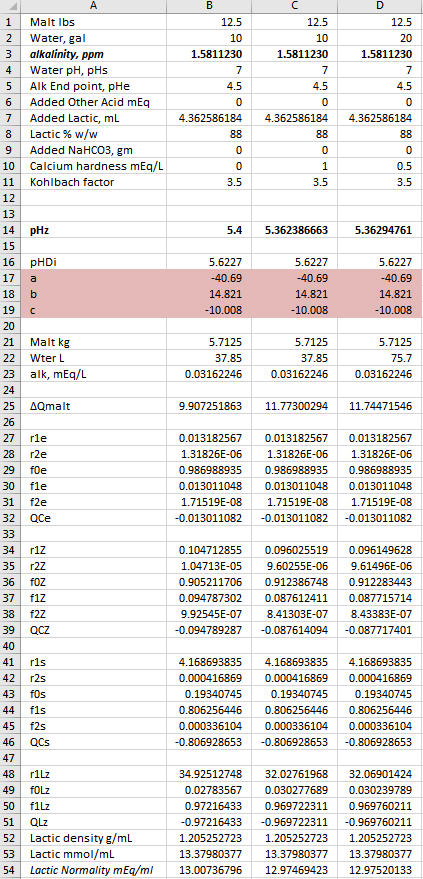
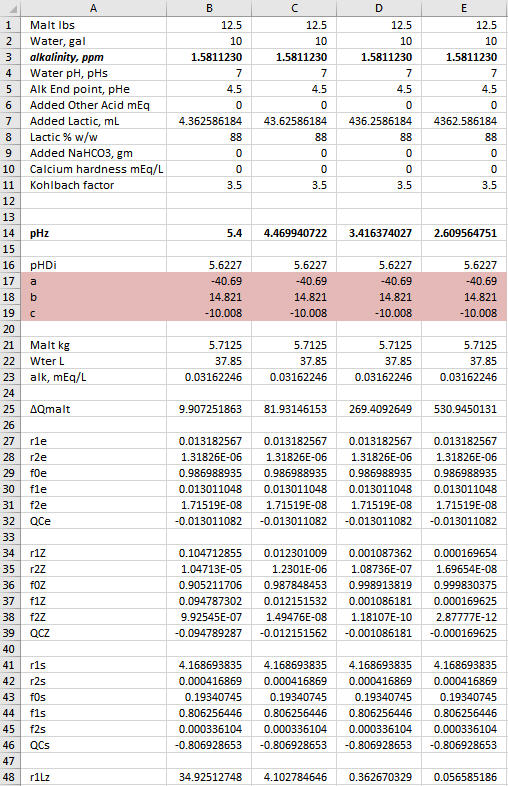
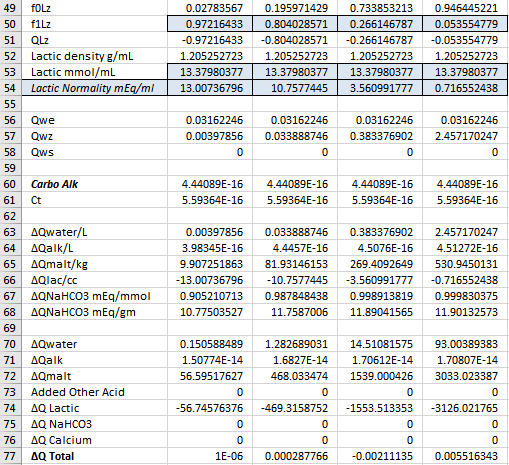
You have at your disposal a tool that will answer that question. Leave Coliumn B as it is in the image you posted. Now copy and paste Column B into Columns C and D so your spreadheet looks like the image. Now set the lactic acid in column C to 10 times what it is in column B and, in Column D to 100 times what it is in column B. Now ask he solver to 0 the Column C sum by adjusting Column C's pHz value and then do the same for Column D. You see what happens by looking at the 3 pHz values. Note that going to 1000 times will get you an answer because now you are adding 4.3 L of acid to 10 gal of water, the pH is getting to the point where it represents activity more than concentration and the dilute solution chemistry the spreadsheet is based on is getting questionable. Be sure to look at the acid normality in each column and then go back to the cells that the normality cell depends on to see if you can figure out why the normality is changing the way it is. It is the spreadsheet's ability to answer questions like this one that makes me think it's a great teaching tool.
 
....As soon as we add in the calcium hardness ∆Q Total shifts because we are still at pH 5.4 but we know that in the real world ∆Q Total = 0 so this time we ask solver to set ∆Q Total to 0 by varying pHz and when it does this we have he value of pHz corresponding to the malt, acid and water quanties as before but with the 1 mEq/L hardness.
Thank you AJ. My numbers now mimic yours to ~0.0000000 accuracy which I believe is more than close enough.
aj-4.jpg

aj-5.jpg


Next I'll try the second excercise when trying to determine how low lactic acid can drop the pH of RO water.
 
....Be sure to look at the acid normality in each column and then go back to the cells that the normality cell depends on to see if you can figure out why the normality is changing the way it is. It is the spreadsheet's ability to answer questions like this one that makes me think it's a great teaching tool.
Now I need to understand why the normality dropped from 13.0 mEq/ml to 0.716 mEq/ml when adding 1000 times the lactic acid as in column B. Clearly I'm seeing diminishing returns of lowering pH as the concentration of lactic acid increases. I wouldn't imaging anyone adding 4.~ liters of acid to 10 gallons of water but I get the point of this excercise and the value of your spreadsheet as a teaching tool.
aj-6.jpg

aj-7.jpg
 
.....Also keep in mind that if you do something based on what I have posted in this thread (augmented with places for additional grains) you get a detailed look at where all the protons are going. You can take the data from an old brew and plug it into your spreadsheet and this one and see where they differ and what may be driving the error you got. For example you may see in a brew whose actual pH was appreciably lower than predicted that one malt was a particularly strong proton absorber and re-examine your model for that malt. Or you may see that your program requires more acid for water of a given alkalinity than this one does and focus on how you handle alkalinity calculations....
@ajdelange I see your point now that I realize the power of your modeling spreadsheet.
 
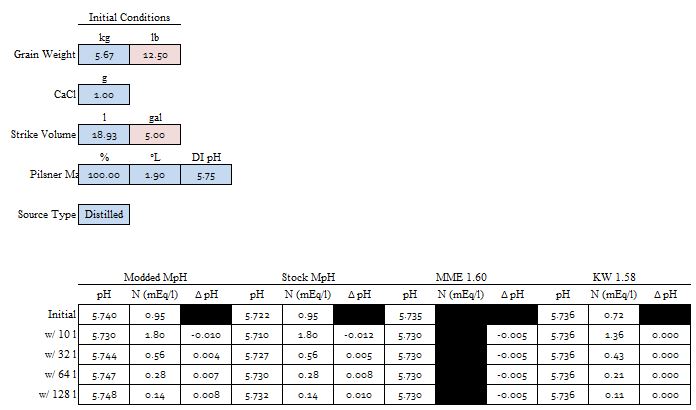
Here is some analysis I ran this morning with my Modded MpH, Stock MpH, MME 1.60 and KW 1.58:
Capture.JPG


KW 1.58 and MME 1.60 show no variance depending on volume.

My modded sheet shows a swing of 0.018 pH units and the stock MpH shows a swing of 0.022 pH units.
 
I noticed another bug in 'Mash Made Easy' and version 1.65 is now up on my website with the repair. Full details of the nature of the bug are to be seen over on the Brewing Software forum. But since it involves the currently being discussed issue of pH reduction due to calcium and magnesium additions, I figured I would also mention it here.
 
Here is some analysis I ran this morning with my Modded MpH, Stock MpH, MME 1.60 and KW 1.58:View attachment 578693

KW 1.58 and MME 1.60 show no variance depending on volume.

My modded sheet shows a swing of 0.018 pH units and the stock MpH shows a swing of 0.022 pH units.

Nice work! With realistic strike water quantity extremes (of 2X perhaps, in keeping with this thread) applied, what is the impact upon the extremes for the mL's of 88% lactic acid required to mash at pH 5.4?
 
Here is some analysis I ran this morning with my Modded MpH, Stock MpH, MME 1.60 and KW 1.58:View attachment 578693

KW 1.58 and MME 1.60 show no variance depending on volume.

My modded sheet shows a swing of 0.018 pH units and the stock MpH shows a swing of 0.022 pH units.
@RPIScotty what other volumns did you use other than 5 gallons?
 
Nice work! With realistic strike water quantity extremes (of 2X perhaps, in keeping with this thread) applied, what is the impact upon the extremes for the mL's of 88% lactic acid required to mash at pH 5.4?

Not sure. I was only after the effect of changing volume on Δ pH. The acid issue seems settled between our sheets.
 
Now I need to understand why the normality dropped from 13.0 mEq/ml to 0.716 mEq/ml when adding 1000 times the lactic acid as in column B. Clearly I'm seeing diminishing returns of lowering pH as the concentration of lactic acid increases.
The underlying concept here is that the sum of the charge changes must be 0 but the path to the charge changes starts with the r's. In this case

r1Lz = [Lac-]/[Hlac] = 10^(pHz - pKlac)

is the ratio of the concentrations of dissociated lactic acid and undissociated lactic acid.
[Lac-]/[Hlac] = 10^(pHz - pKlac) is the Henderson-Hasselbalch equation which is, as you can clearly see from the number of r cells in the spreadsheet, is at the core of this chemistry.

I wouldn't imaging anyone adding 4.~ liters of acid to 10 gallons of water but I get the point of this excercise and the value of your spreadsheet as a teaching tool.
No, but suppose you wanted to know the pH of the 88% lactic acid sitting on your bench? I get just under 1 but doubt very much that if I dunked a pH electrode into the bottle that I'd see that for reasons mentioned in an earlier post. But if I look at Sigma Aldrich's MSDS of their 85% lactic acid I see that a 1% solution of that has a reported pH of 2 (note single digit precision) and this spreadsheet computes 2.37 which, to a single digit is 2 so perhaps undiluted it might really be around 1.

In any case you are awarded the Solver Medallion d'Or with Oak Leaf Cluster. If you have Excel and aren't using Solver you are missing out on a lot of the products power. Now there are two of us!
 
Last edited:
The free 'LibreOffice Calc' also has the "Solver" feature (at least in the new version 6). A great tool!!!
 
Back
Top