So, I've been working on this for a month or so, initially the hardware used a program that steve71 made on HBT, but I found it was extremely limited (1 output, a specific controller input, and some other annoyances). The next iteration needed to be rebased, and now I've made significant improvements
First things first: Github Repo for the code - Elsinore Server
Elsinore Android App
I will add be updating frequently as I find improvements/bugs, this is an Alpha for all intents and puposes
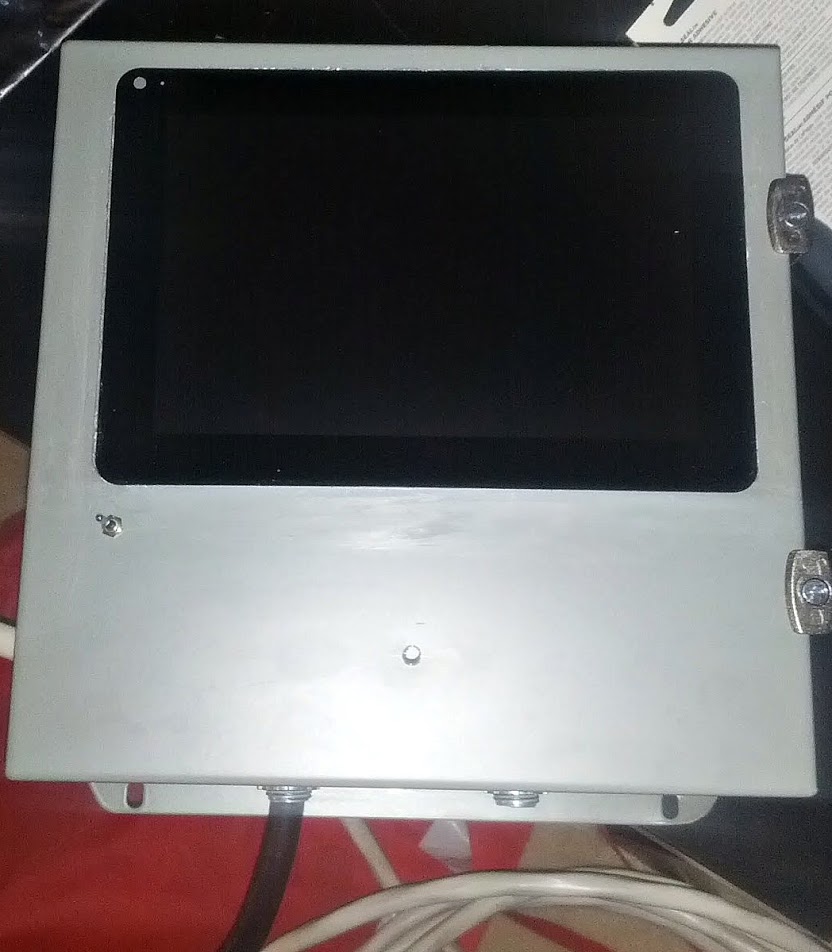
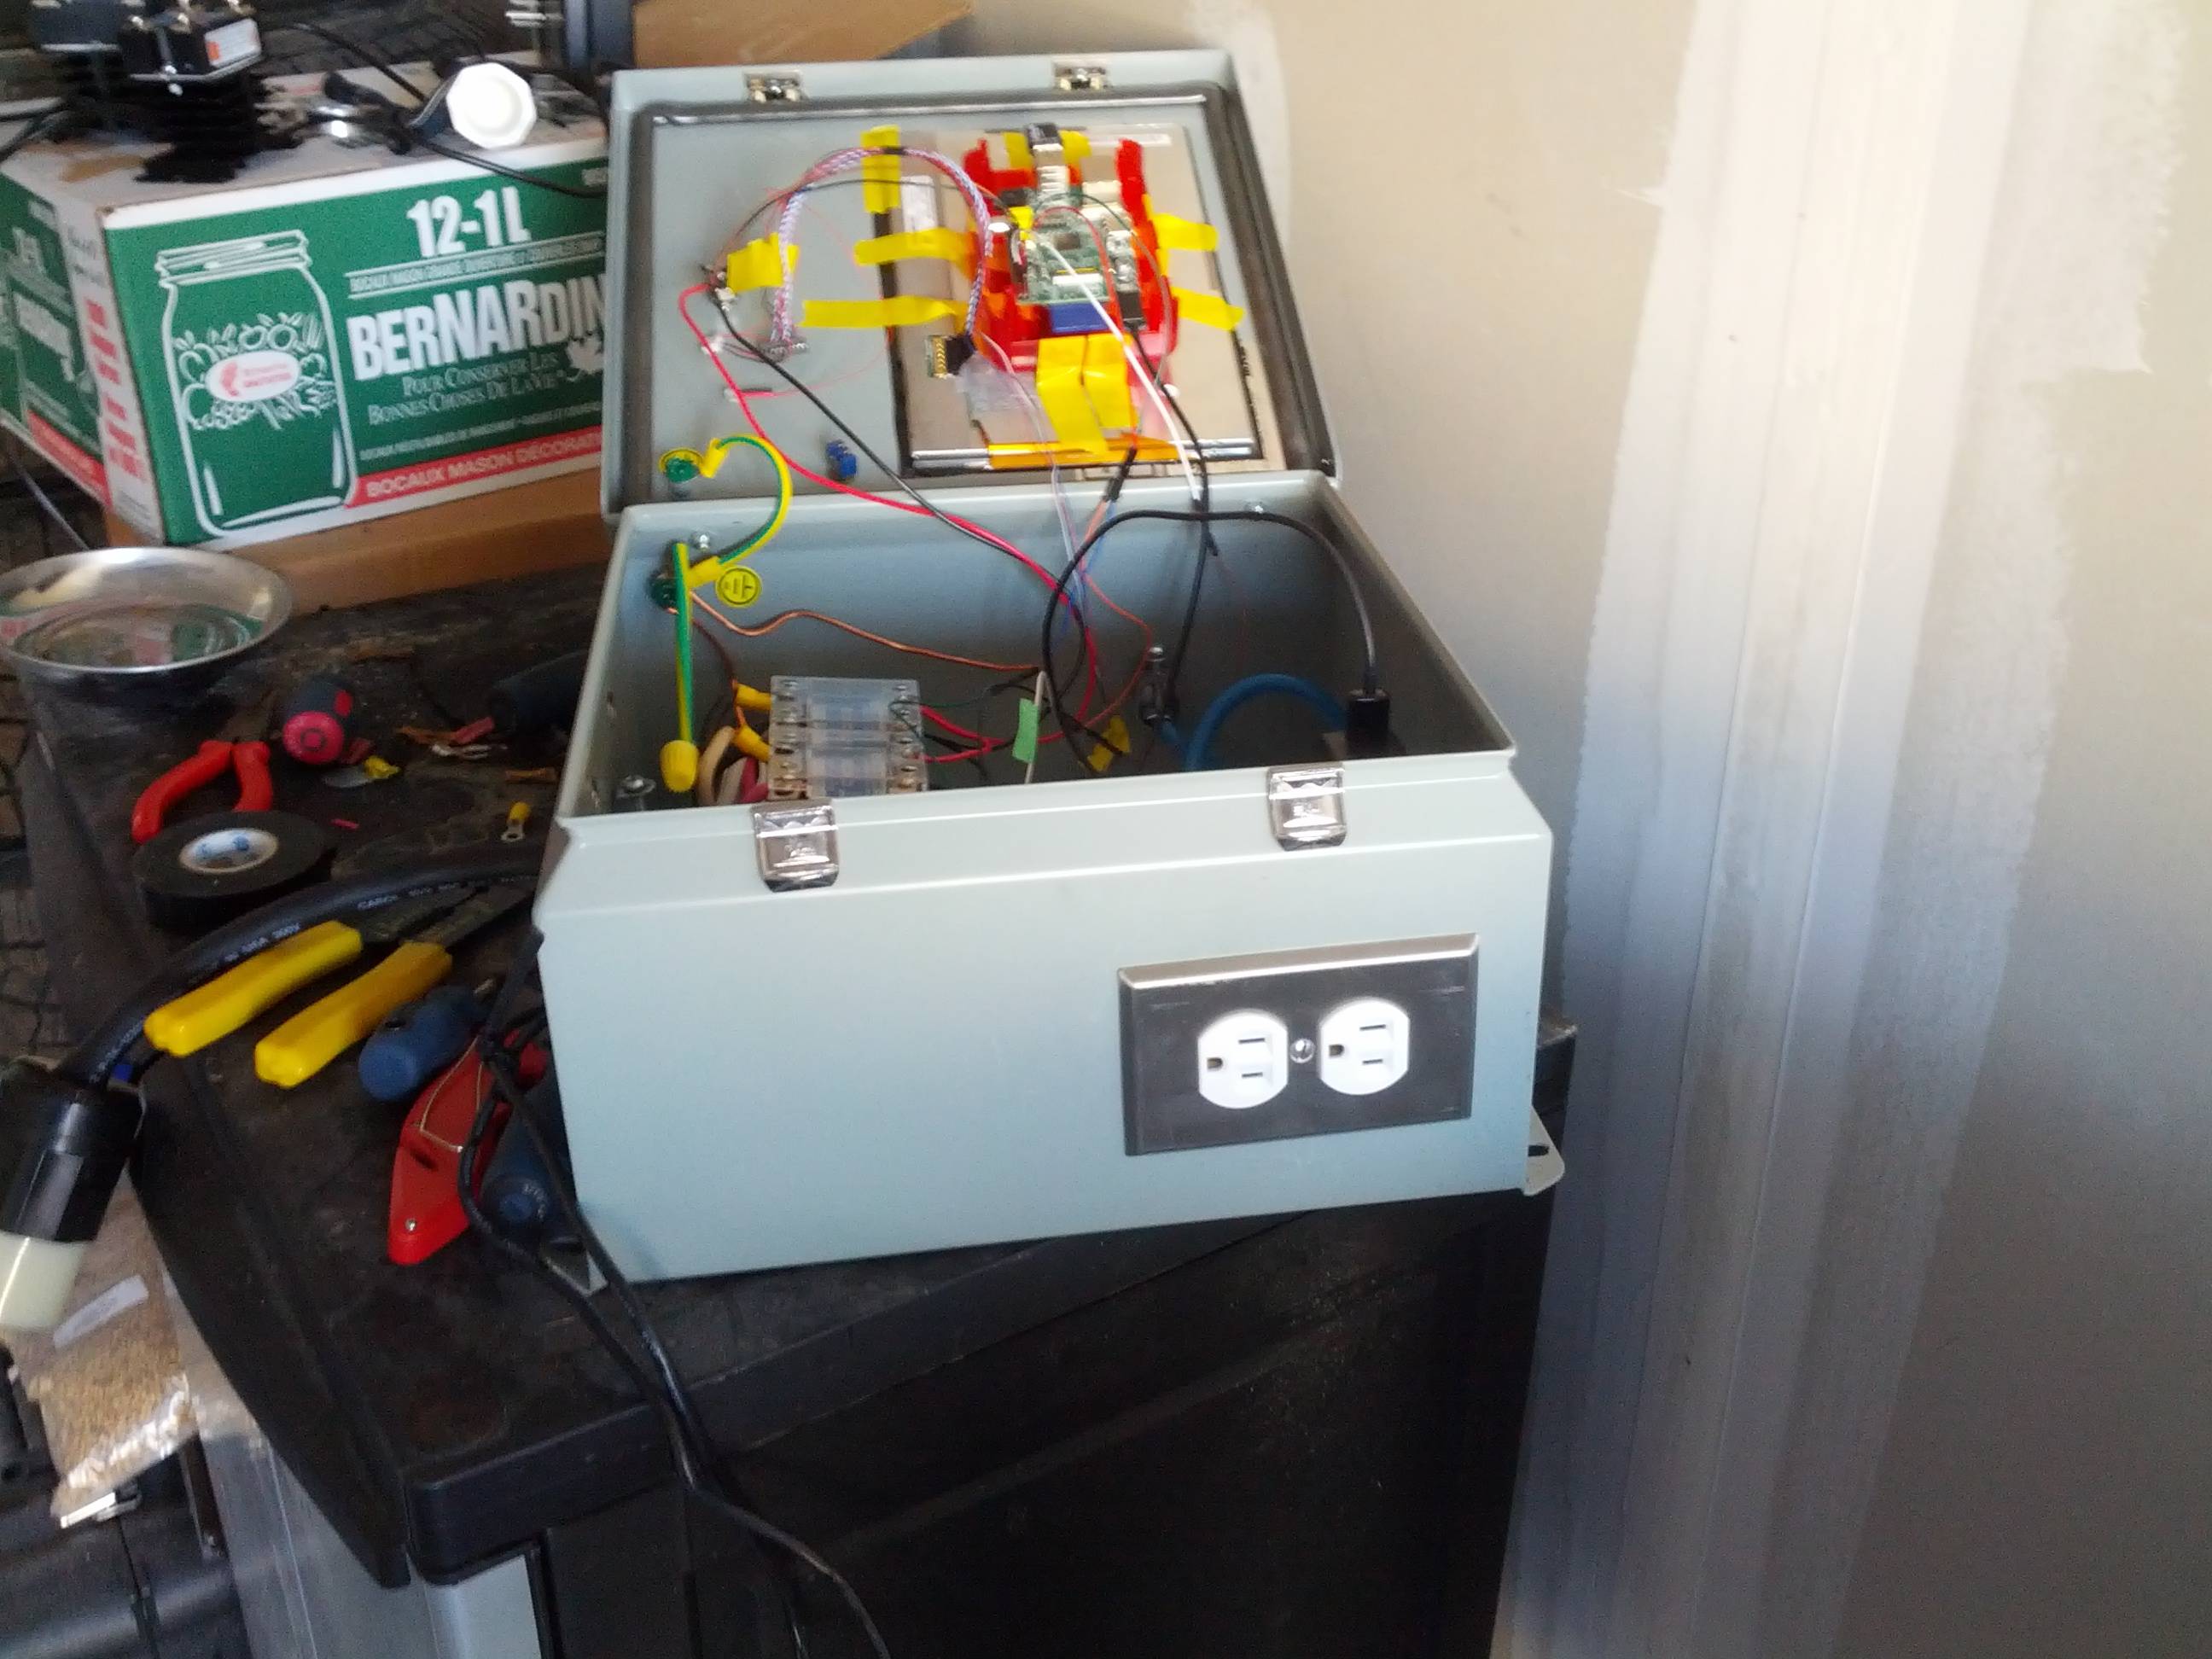
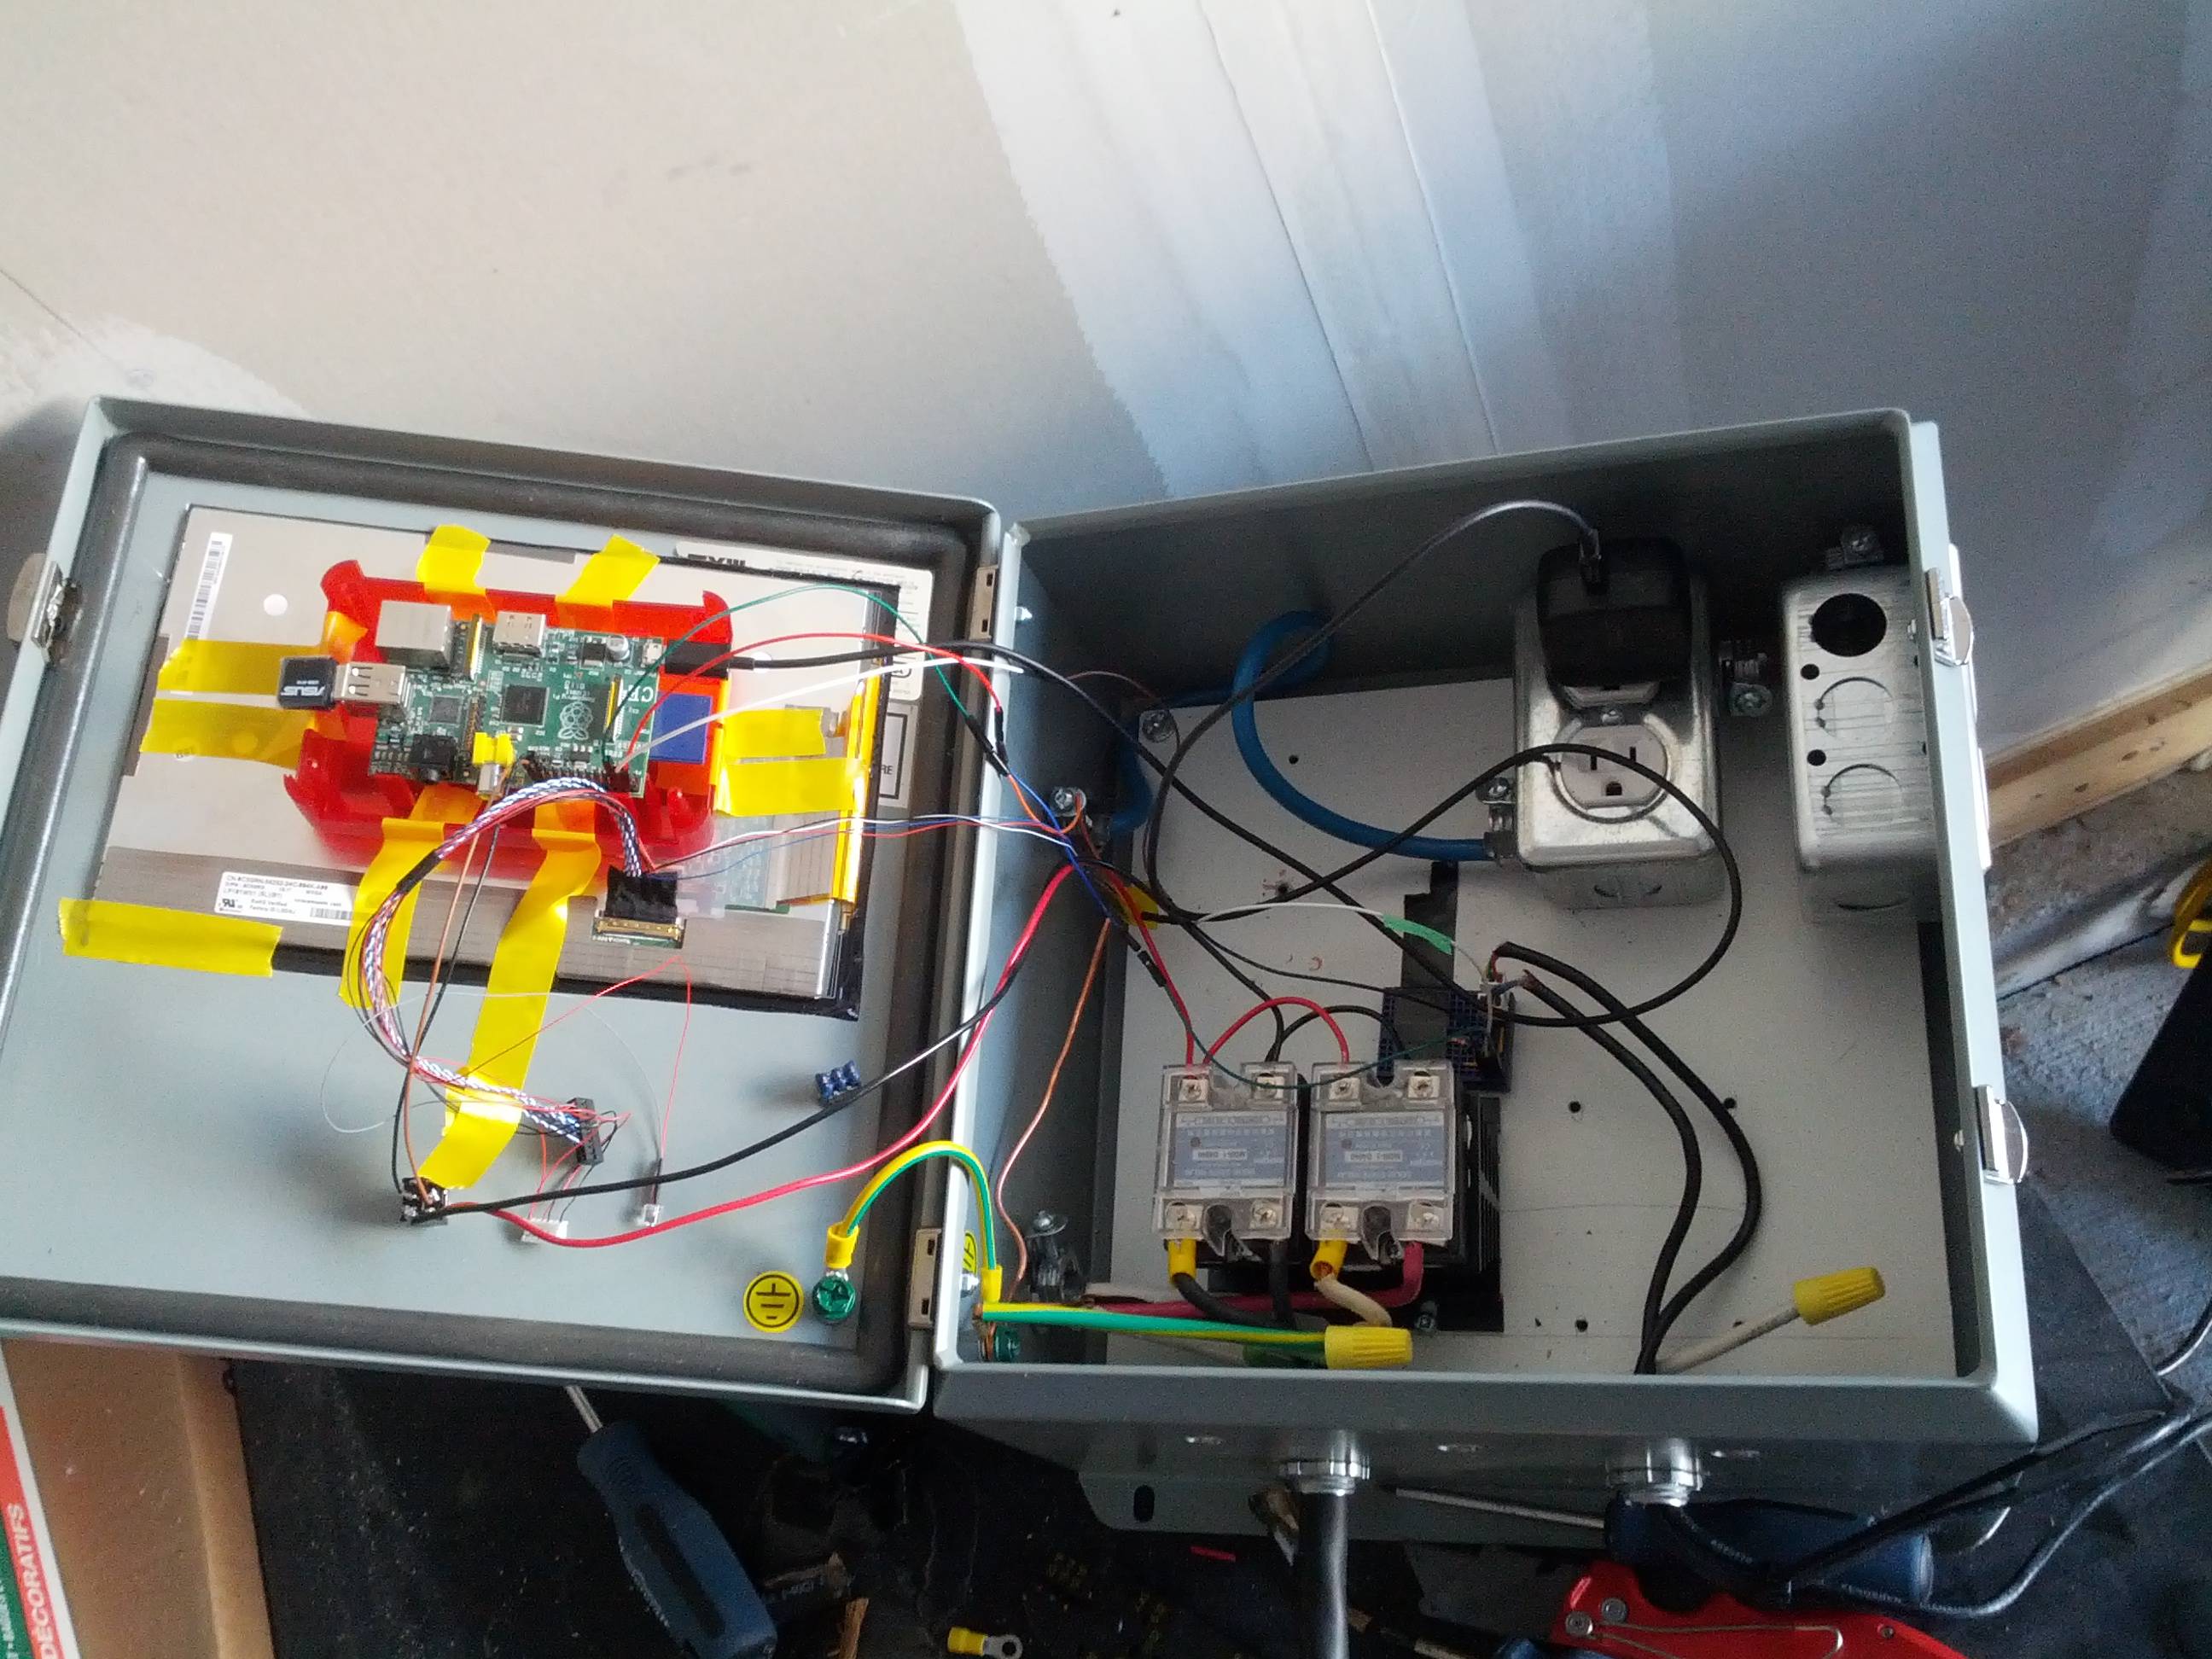
So the raspberry pi is a tiny (credit card size, almost), cheap ($35) PC with GPIO, 1Wire, PWM, and more on it, but it has the advantage of being able to run full linux in a low power environment via an SD card.
The basic setup is:
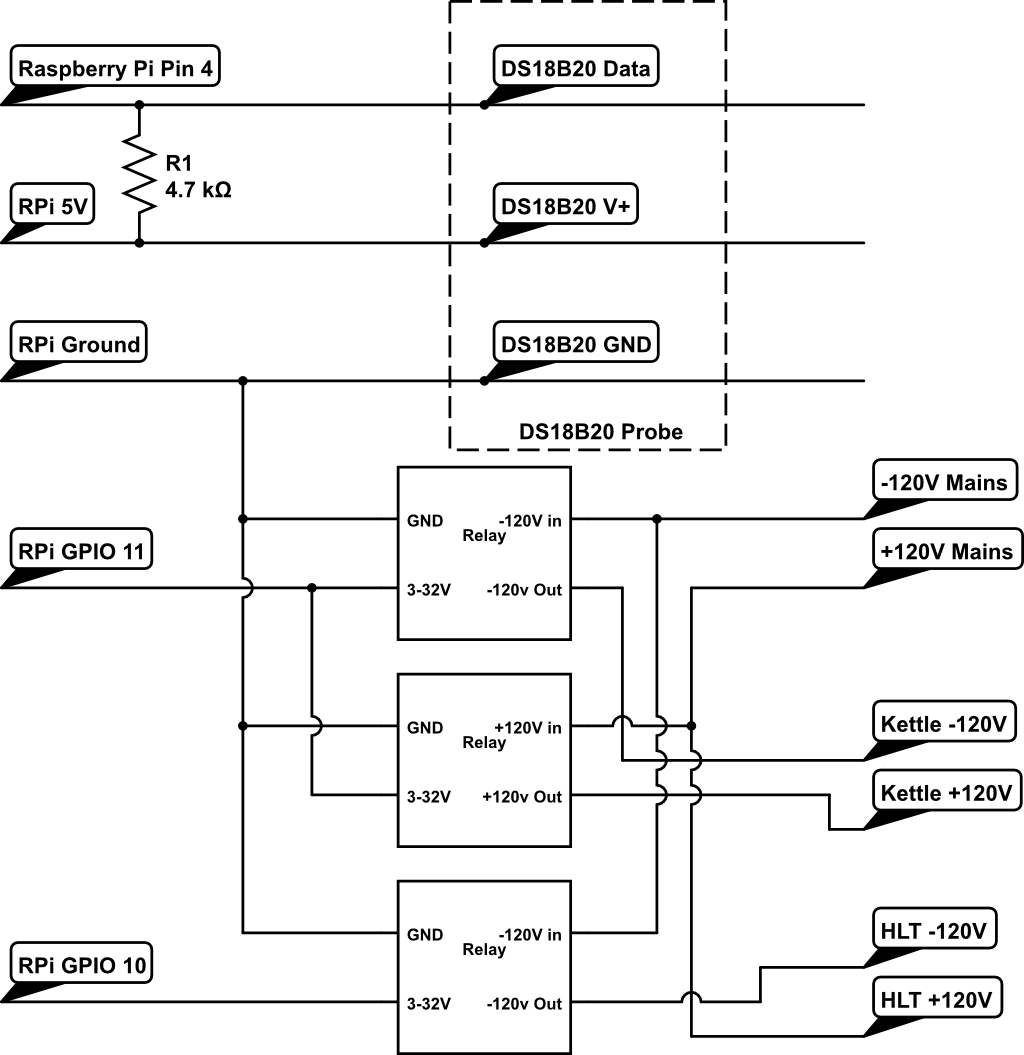
Raspberry Pi with Debian installed and 1wire modules, connected to 1wire DS18B20 probes, and SSR outputs.
The inputs are the 1wire probes, which are accurate enough for this kind of work, they can be chained on one bus which helps to reduce footprint.
The SSRs control the -120v and +120v (or just one if you want to save a bit of cash) to the elements.
Circuit Diagram
It is designed to throw JSON style data out constantly (using the /getstatus URL):
{"hlt_pid":
{"elapsed":1361666853197,"scale":"F","cycle":2.0,"duty":0.0,"p":4.0,"gpio":11,"temp":37.4,"setpoint":175.0,"k":41.0,"i":169.0,"mode":"off"},
"kettle_temp":
{"elapsed":1361666852388,"scale":"F","temp":37.2866}
}
In this example the HLT is setup as a PID (there's a GPIO pin setup in the config file, and a temperature probe setup), the Kettle is setup with a probe and no GPIO, so it's only reading the temperature.
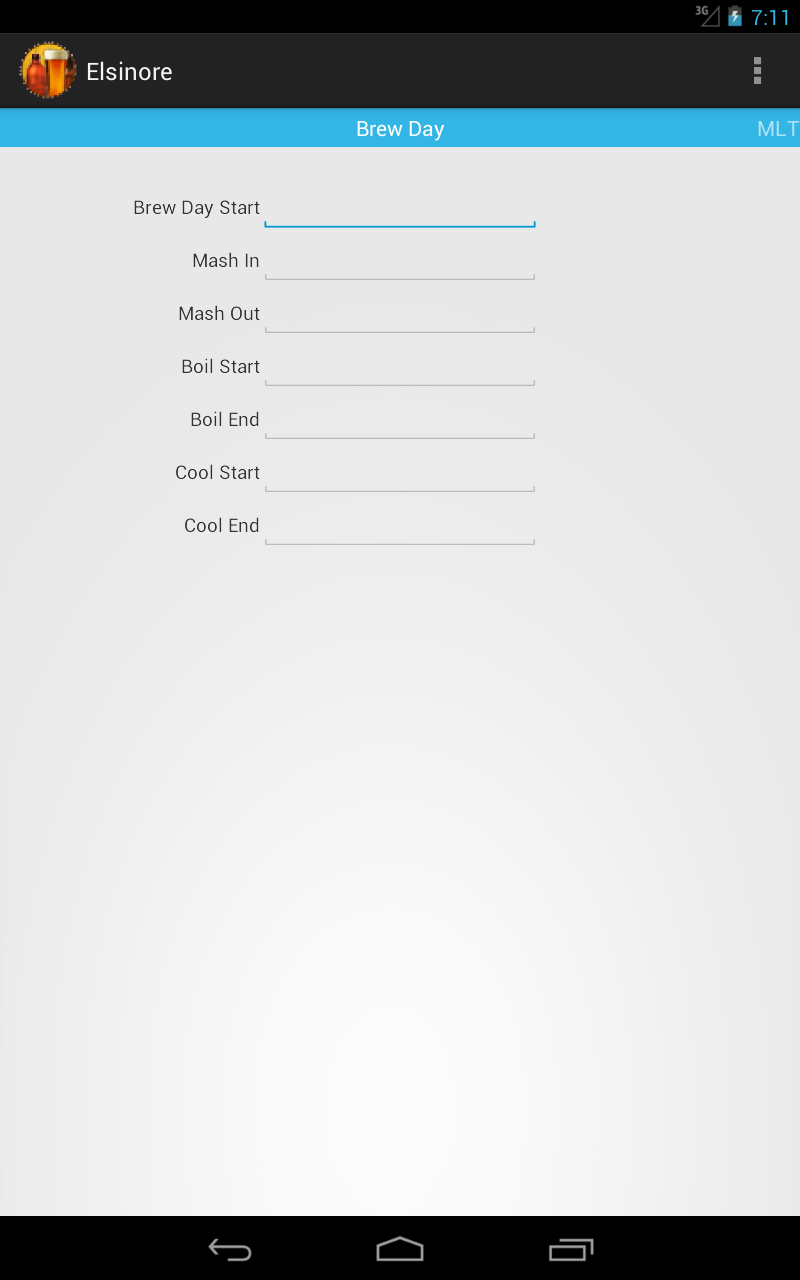
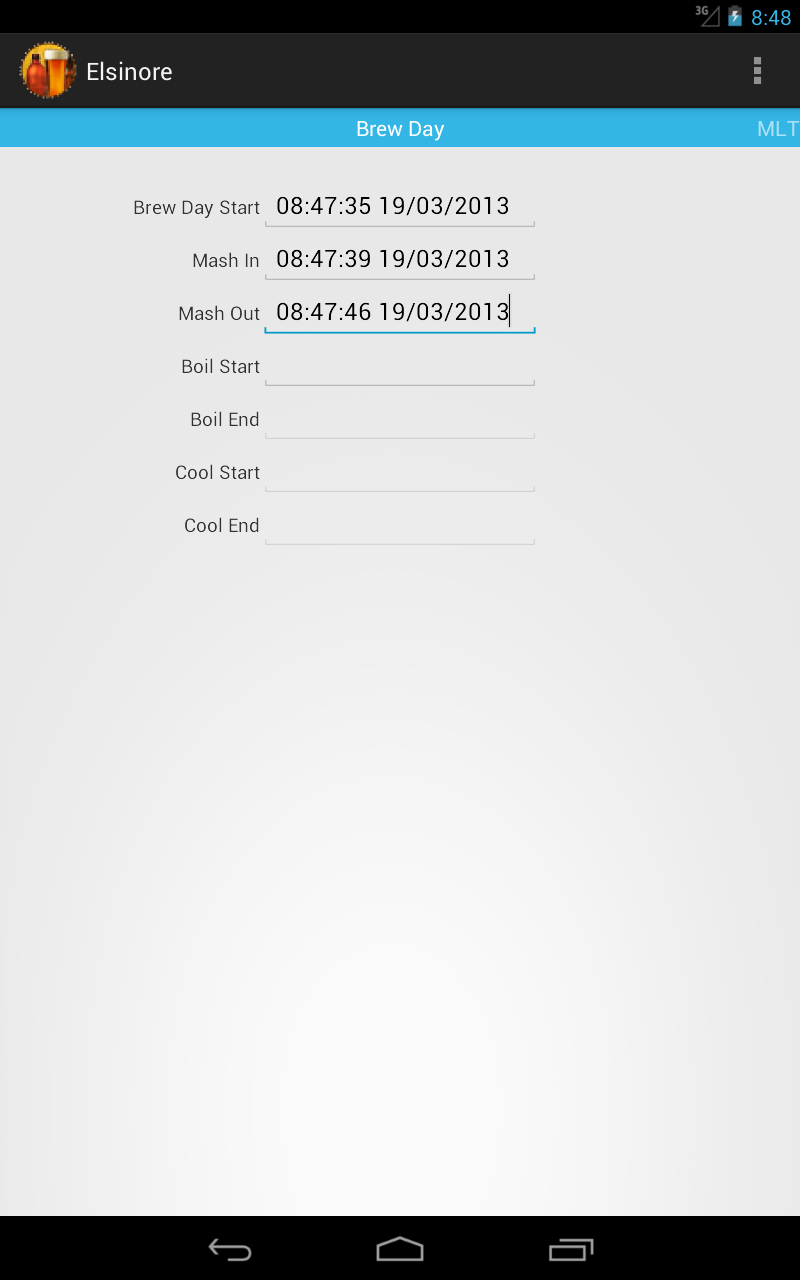
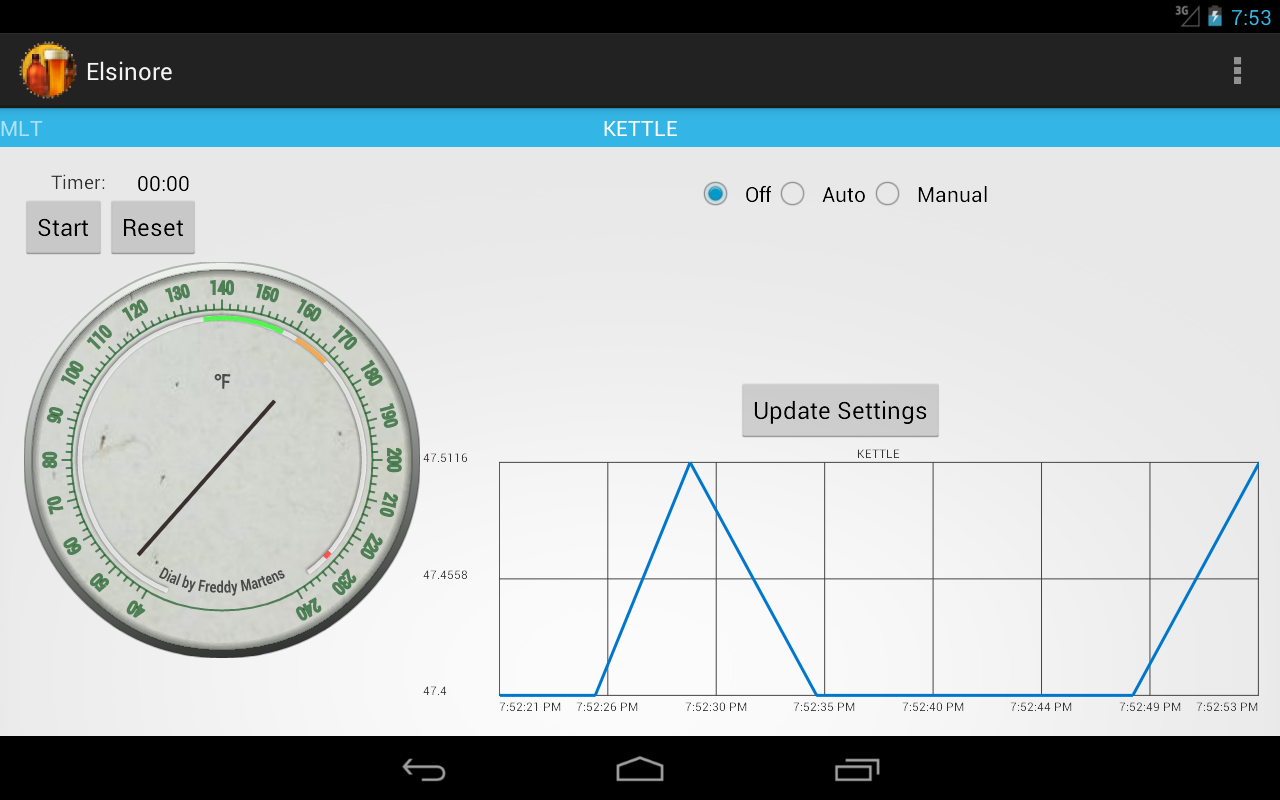
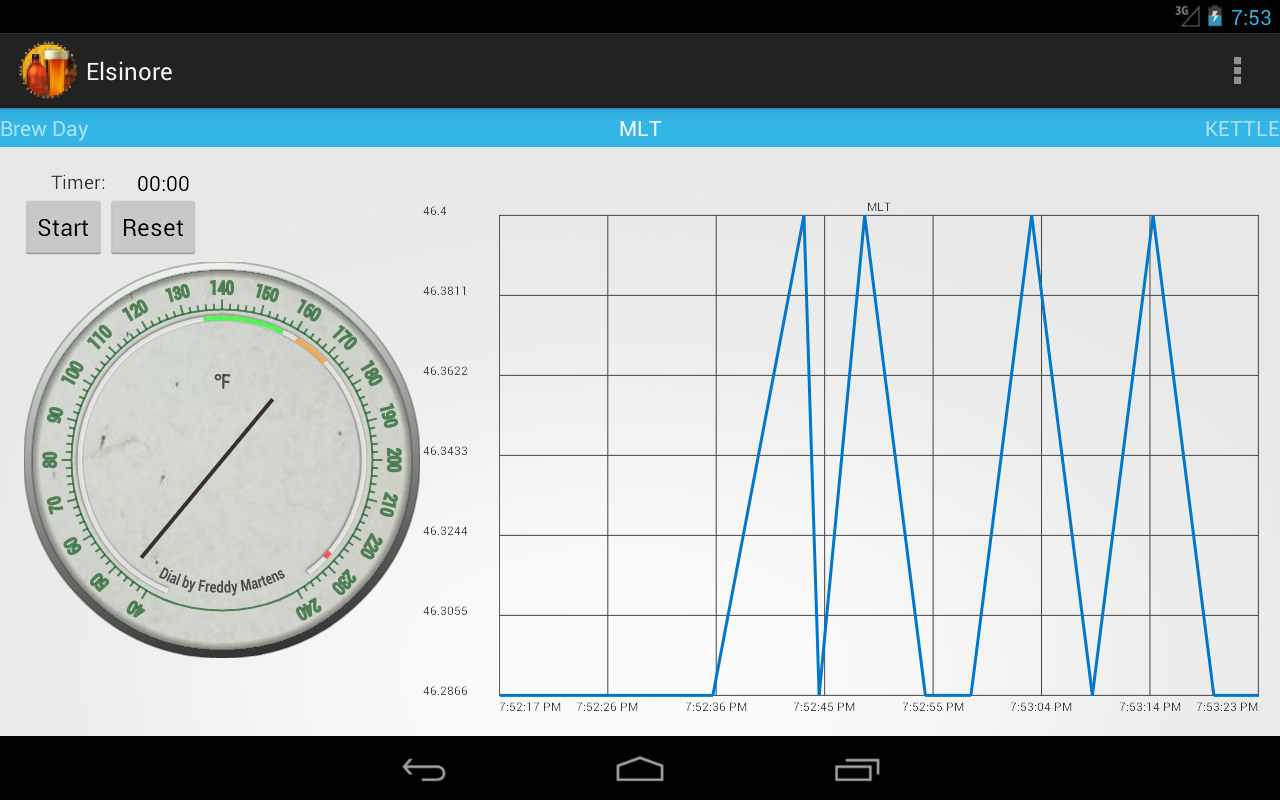
Here is an example of the Android I have made, and uploaded, (ignore the names of the devices, I've been playing)
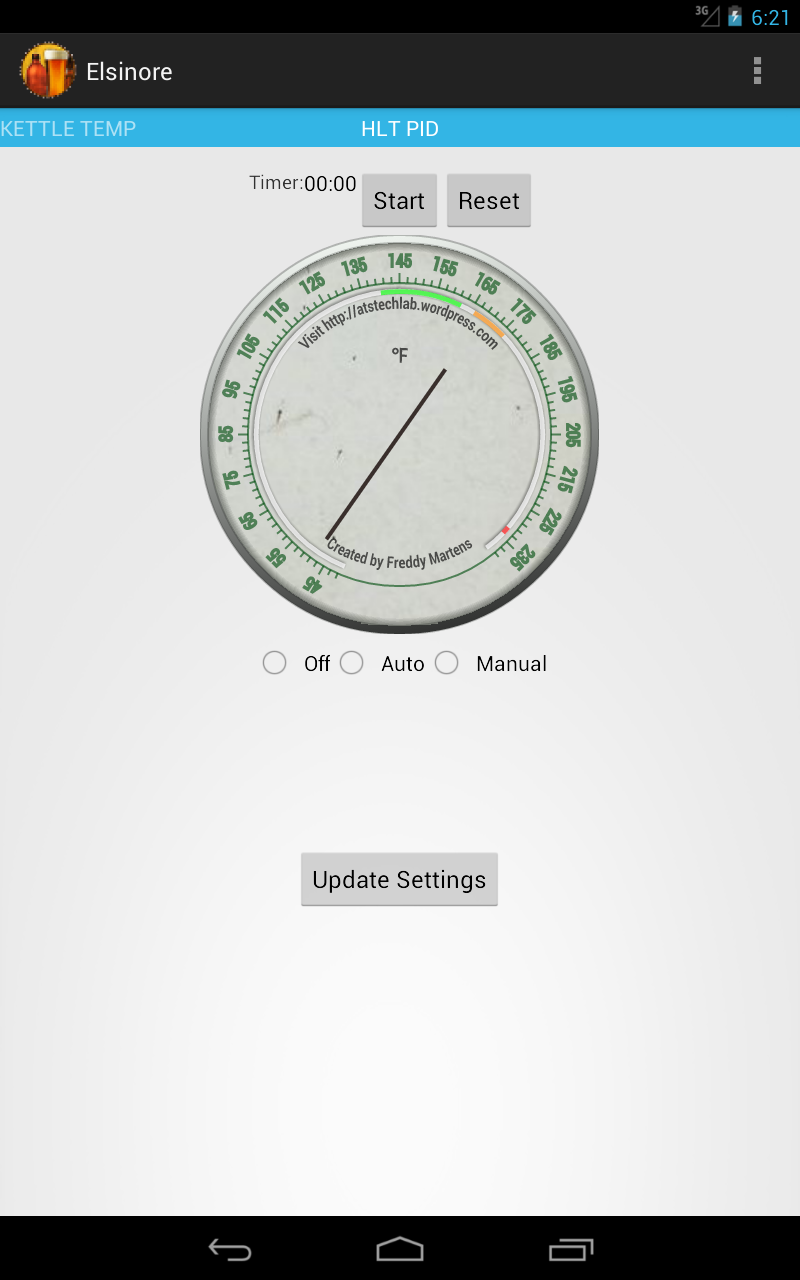
The settings allow you to specify the server name and port, as well as the refresh time.
UPDATES:
[Sunday March 17th]
Uploaded new versions of Server and app
The server now supports connections to COSM (formally pachube) so data will be uploaded to datastreams for each device that you have. These pushes only occur when you get data from the server locally, so if you use the android application, it will only update whilst that is running. If you quit the application it will stop pushing data to COSM. The data is pushed from the Elsinore Server to Cosm, not from the android application.
For example: https://cosm.com/feeds/119008 is my feed for Elsinore. You can call it whatever you want, but the datastreams will be made to match your setup if they don't exist already. Annoyingly you can't tell Cosm to display in your timezone.
So I added an extra url: getimages (i.e. https://elsinore:8080/getimages) which will get the last 8 hours of data from Cosm and dump it out to files in the "graphs" directory. I'm going to add extra details like a start/end time customization, and some better axes, but the Cosm API is a bit fiddly and apparently frequently changing.
Once you've gone to the getimages URL, you can then go back to the root/graphs directory (i.e. http://elsinore:8080/graphs/) to see all the images.
Long term, this'll be made into a brewing report.
The Android application itself has received a load of updates (and workarounds for Android bugs), so it now does work correctly, and will show the correct dial range, Celsius or Fahrenheit, depending on what the server is set to.
[18th March] More updates:
I've made a few more changes, like adding a launcher script
You can also specify the start and end time of the images (in your local timezone, or any timezone)
keezer:8080/getimages?startDate=2013-03-16T02:07:10-04:00&endDate=2013-03-16T18:07:10-04:00
Gets the graph between the startdate and endDate (-04:00 is the timezone different to UTC), I'll be updating the android controller to have a start brewday, end brew day, start Mash, end Mash, etc... form to allow multiple graphs to be selected.
[UPDATE Mar 20th]
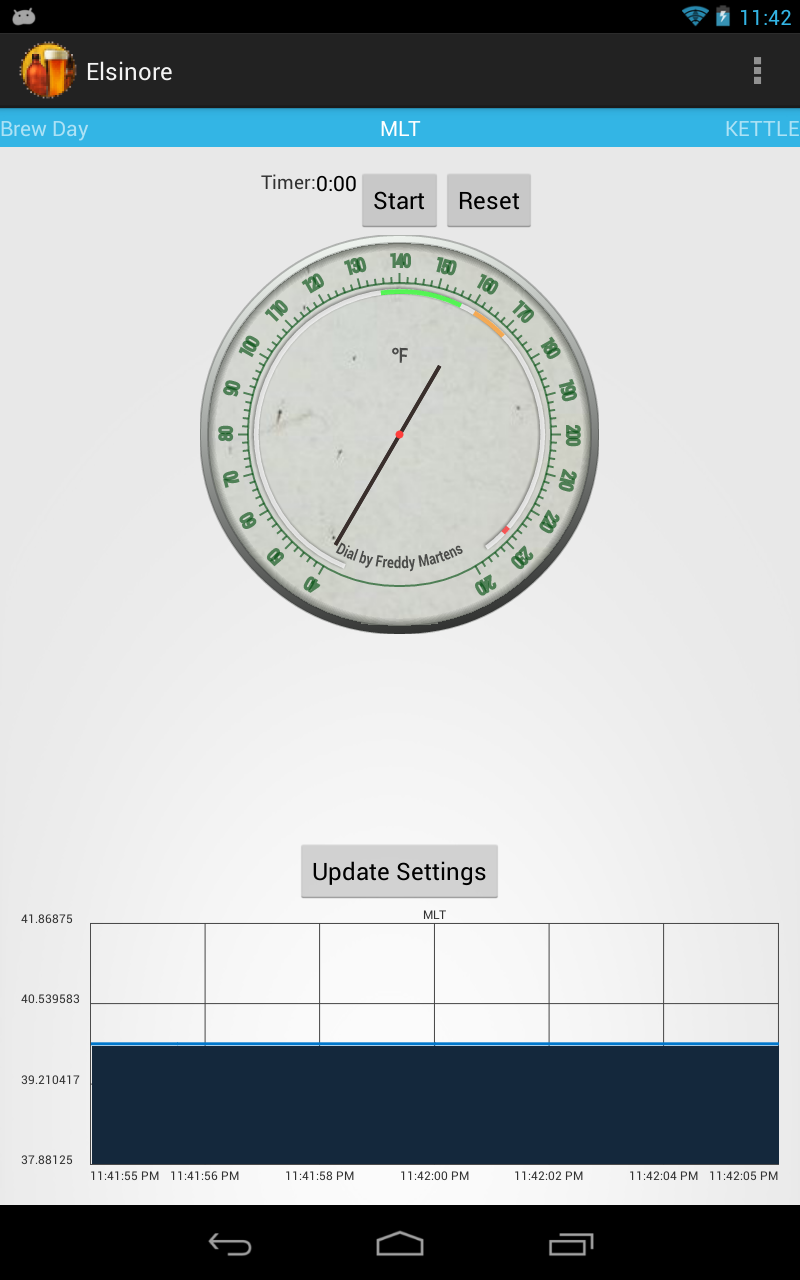
Decided to play with a local graph (and fix a crap load of annoyances)
So it live updates the graph as you're going, more as an informative thing. I'll add the setpoint if there is one later so you can see how far away you are")
Repositories are all up to date now.
First things first: Github Repo for the code - Elsinore Server
Elsinore Android App
I will add be updating frequently as I find improvements/bugs, this is an Alpha for all intents and puposes
So the raspberry pi is a tiny (credit card size, almost), cheap ($35) PC with GPIO, 1Wire, PWM, and more on it, but it has the advantage of being able to run full linux in a low power environment via an SD card.
The basic setup is:
Raspberry Pi with Debian installed and 1wire modules, connected to 1wire DS18B20 probes, and SSR outputs.
The inputs are the 1wire probes, which are accurate enough for this kind of work, they can be chained on one bus which helps to reduce footprint.
The SSRs control the -120v and +120v (or just one if you want to save a bit of cash) to the elements.
Circuit Diagram
It is designed to throw JSON style data out constantly (using the /getstatus URL):
{"hlt_pid":
{"elapsed":1361666853197,"scale":"F","cycle":2.0,"duty":0.0,"p":4.0,"gpio":11,"temp":37.4,"setpoint":175.0,"k":41.0,"i":169.0,"mode":"off"},
"kettle_temp":
{"elapsed":1361666852388,"scale":"F","temp":37.2866}
}
In this example the HLT is setup as a PID (there's a GPIO pin setup in the config file, and a temperature probe setup), the Kettle is setup with a probe and no GPIO, so it's only reading the temperature.
Here is an example of the Android I have made, and uploaded, (ignore the names of the devices, I've been playing)
The settings allow you to specify the server name and port, as well as the refresh time.
UPDATES:
[Sunday March 17th]
Uploaded new versions of Server and app
The server now supports connections to COSM (formally pachube) so data will be uploaded to datastreams for each device that you have. These pushes only occur when you get data from the server locally, so if you use the android application, it will only update whilst that is running. If you quit the application it will stop pushing data to COSM. The data is pushed from the Elsinore Server to Cosm, not from the android application.
For example: https://cosm.com/feeds/119008 is my feed for Elsinore. You can call it whatever you want, but the datastreams will be made to match your setup if they don't exist already. Annoyingly you can't tell Cosm to display in your timezone.
So I added an extra url: getimages (i.e. https://elsinore:8080/getimages) which will get the last 8 hours of data from Cosm and dump it out to files in the "graphs" directory. I'm going to add extra details like a start/end time customization, and some better axes, but the Cosm API is a bit fiddly and apparently frequently changing.
Once you've gone to the getimages URL, you can then go back to the root/graphs directory (i.e. http://elsinore:8080/graphs/) to see all the images.
Long term, this'll be made into a brewing report.
The Android application itself has received a load of updates (and workarounds for Android bugs), so it now does work correctly, and will show the correct dial range, Celsius or Fahrenheit, depending on what the server is set to.
[18th March] More updates:
I've made a few more changes, like adding a launcher script
You can also specify the start and end time of the images (in your local timezone, or any timezone)
keezer:8080/getimages?startDate=2013-03-16T02:07:10-04:00&endDate=2013-03-16T18:07:10-04:00
Gets the graph between the startdate and endDate (-04:00 is the timezone different to UTC), I'll be updating the android controller to have a start brewday, end brew day, start Mash, end Mash, etc... form to allow multiple graphs to be selected.
[UPDATE Mar 20th]
Decided to play with a local graph (and fix a crap load of annoyances)
So it live updates the graph as you're going, more as an informative thing. I'll add the setpoint if there is one later so you can see how far away you are
Repositories are all up to date now.