WSSC - Potomac Water Analysis

Homebrew Talk - Beer, Wine, Mead, & Cider Brewing Discussion Forum

Help Support Homebrew Talk - Beer, Wine, Mead, & Cider Brewing Discussion Forum:

This site may earn a commission from merchant affiliate links, including eBay, Amazon, and others.

brettwasbtd

Awesomeness Award Winnner
HBT Supporter
Joined
Apr 20, 2010
Messages
1,793
Reaction score
165
Location
Damascus, MD
So I was trying to look at the Water Analysis reports put out by the water companies and see if I could notice any useful trends. Looking for any thoughts on whether these monthly averages could be a good rule of thumb vs the yearly or multiple year averages. (See spreadsheet link) OR is this too dependent on other factors that looking at values at certain times of year is not useful?

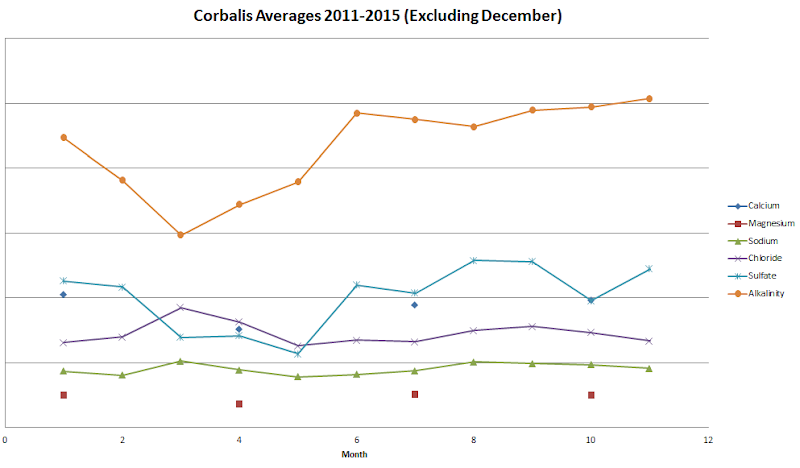
I get my water from WSSC potomac source, however, they only produce a yearly report with averages so I pulled that data from the Fairfax Corbalis plant which is monthly. I believe this plant is getting roughly the same source Potomac river water. I then loaded all the data into a spreadsheet and made a few line charts. Looking at the data it seems like around March the water is the softest and it then works its way up to the highest point around November.


Here are the averages for the different values for each plant by year over the past few years:

Image of averages:
water2.PNG


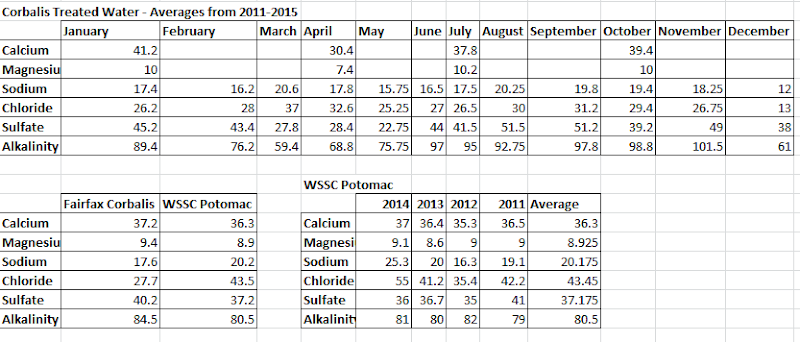
Chart of Corbalis Averages 2011-2015:
water1.PNG


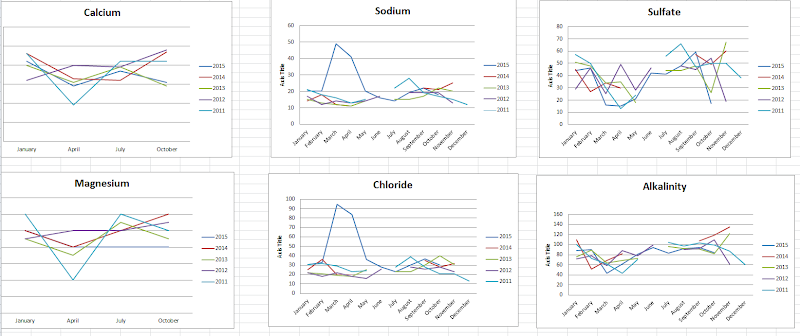
Individual values 2011-2015
water3.PNG


Anyways, I know there are quite a few people in the area and water questions pop up a lot. Hopefully this info can help and narrow down source water (by month) to use with predicting our water.
 
Anyone have thoughts? Looking again at these charts 2015 seemed to have some large chloride swings in March and April which would affect those averages
 
No comments really. Big load of, presumably, road salt in the one year but other than that variations are quite reasonable. Yes, Corbalis and WSSC get their water from the same river and at nearly the same place.
 
No comments really. Big load of, presumably, road salt in the one year but other than that variations are quite reasonable. Yes, Corbalis and WSSC get their water from the same river and at nearly the same place.

Ah yes, didn't even think about the areas higher than usual snow leading to more salt shortly after.

So would using the monthly averages be better than the yearly? Part of me thinks some of my beers would be better off starting from RO just for the sake of consistency
 
RO is the solution to which more and more brewers (craft and home) seem to be turning and it does grant the ultimate control over brewing water chemistry. So that is probably the best approach. Second best would be to measure tap water each time you brew. I used to do that and it just adds more time to the brew day (though you can do it a day or 2 in advance). Third best would be to check just the alkalinity as that (the bad news) seems to be the most variable and has the most profound effect while at the same time (the good news) it is the easiest parameter to measure. Fourth best would be to just use the monthly averages and of course many of us did (or do) exactly that. This is in my opinion anyway.
 
Disclaimer: While water treatment is something I pay attention to, I am by no means an expert on the topic.


I had my water tested in Oct 2014 and wondered about how much variation there could be in the mineral content. I think I get my water from WSSC Potomac. My initial impression is that those numbers are far more stable than I expected. The WSSC Potomac tap analysis report shows much bigger swings between the max and min levels.

I posted my Ward Lab results here: https://www.homebrewtalk.com/showthread.php?t=542557. The only thing that stands out to me as significantly different is the chloride. The other post has some more data but here's the data relevant to the Bru'n Water Spreadsheet:

Ca: 43
Mg: 10
Na: 21
K: 4
Fe: 0.02
HCO3: 90
CO3: 0.5
SO4: 42 (reported as SO4-N @ 14; Bru'n Water says to multiply by 3)
Cl: 45
NO3: 3 (reported as NO3-N @1; Bru'n Water says to multiply by 3)

I've always wondered how much the monthly variation would alter my additions and your data sheds some light on this. So using the Bru'n Water spreadsheet, here are the treatments I would need for each of 3 targets, using my current water, assuming 4 gallons of mash water and 4 gallons of sparge water:


  • Yellow/Bitter - 1.6g of Gypsum (CaSO4) in both the mash and sparge.
  • Amber/Balanced - 0.8g of Gypsum (CaSO4) in both
  • Brown/Malty - 0.8g of CaCL in both

And theme using the April averages you provided, (which to my eye are the most different from my Ward Lab results):

  • Yellow/Bitter - 2.0g of Gypsum (CaSO4) in both the mash and sparge.
  • Amber/Balanced - 1.4g of Gypsum (CaSO4) in both
  • Brown/Malty - 1g of CaCL in both


So it looks like there's a maximum difference of half 1.2 grams (amber/balanced). That seems like a small number, but then again its a 43% increase. Actually, its probably more useful to look at it in terms of total concentration since a large chunk comes from the water, not the additions. So the dip in minerals in April causes you to lose about 18% of your Ca, and 28% of your SO4 (compared to my WL results--which are close to the Oct averages in your chart).

For the chloride, the levels appear pretty consistent in your chart, but my testing was a bit higher. Looking at the WSSC tap water analysis for 2014, the average chloride content is 55mg/L--which is the highest monthly number in your chart. (it also varies from 26-233(!)) So perhaps the treatment by WSSC and Corbalis explains that difference. Had I used the October averages instead of my actual tested results, the difference would have been much smaller.

The Sulfate fluctuation is the significant finding, with a clear dip in the spring. That is why the additional gypsum was needed in the spring. I looked at the 2014 tap water analysis for WSSC, and they report an average of 36mg/L with a range of 10-94. But like you said, there's just max and min, not monthly numbers, so we can't discern whether the pattern matches.

I don't know why the sulfate is lower in the spring. I did a little looking online and its doesn't appear that MD uses any deicer that contains sulfate. Regardless, we should consider using a bit more gypsum in our spring brews.
 
Ah yes, didn't even think about the areas higher than usual snow leading to more salt shortly after.

So would using the monthly averages be better than the yearly? Part of me thinks some of my beers would be better off starting from RO just for the sake of consistency

MD uses salt on the roads--NaCl, and there doesn't appear to be a surge in either Na or Cl in the later winter or early spring.
 
MD uses salt on the roads--NaCl, and there doesn't appear to be a surge in either Na or Cl in the later winter or early spring.
Yes, and they store it under those beehive things (lots used to get washed into the environment just from rain on the storage piles). But note from OP's data that the NaCl surge did occur in early spring (March) but only in the one year. I can't remember whether that was a particularly nasty winter or not.
 
RO is the solution to which more and more brewers (craft and home) seem to be turning and it does grant the ultimate control over brewing water chemistry. So that is probably the best approach. Second best would be to measure tap water each time you brew. I used to do that and it just adds more time to the brew day (though you can do it a day or 2 in advance). Third best would be to check just the alkalinity as that (the bad news) seems to be the most variable and has the most profound effect while at the same time (the good news) it is the easiest parameter to measure. Fourth best would be to just use the monthly averages and of course many of us did (or do) exactly that. This is in my opinion anyway.
I like the order you set here.

Disclaimer: While water treatment is something I pay attention to, I am by no means an expert on the topic.


I had my water tested in Oct 2014 and wondered about how much variation there could be in the mineral content. I think I get my water from WSSC Potomac. My initial impression is that those numbers are far more stable than I expected. The WSSC Potomac tap analysis report shows much bigger swings between the max and min levels.

I posted my Ward Lab results here: https://www.homebrewtalk.com/showthread.php?t=542557. The only thing that stands out to me as significantly different is the chloride. The other post has some more data but here's the data relevant to the Bru'n Water Spreadsheet:

Ca: 43
Mg: 10
Na: 21
K: 4
Fe: 0.02
HCO3: 90
CO3: 0.5
SO4: 42 (reported as SO4-N @ 14; Bru'n Water says to multiply by 3)
Cl: 45
NO3: 3 (reported as NO3-N @1; Bru'n Water says to multiply by 3)

I've always wondered how much the monthly variation would alter my additions and your data sheds some light on this. So using the Bru'n Water spreadsheet, here are the treatments I would need for each of 3 targets, using my current water, assuming 4 gallons of mash water and 4 gallons of sparge water:


  • Yellow/Bitter - 1.6g of Gypsum (CaSO4) in both the mash and sparge.
  • Amber/Balanced - 0.8g of Gypsum (CaSO4) in both
  • Brown/Malty - 0.8g of CaCL in both

And theme using the April averages you provided, (which to my eye are the most different from my Ward Lab results):

  • Yellow/Bitter - 2.0g of Gypsum (CaSO4) in both the mash and sparge.
  • Amber/Balanced - 1.4g of Gypsum (CaSO4) in both
  • Brown/Malty - 1g of CaCL in both


So it looks like there's a maximum difference of half 1.2 grams (amber/balanced). That seems like a small number, but then again its a 43% increase. Actually, its probably more useful to look at it in terms of total concentration since a large chunk comes from the water, not the additions. So the dip in minerals in April causes you to lose about 18% of your Ca, and 28% of your SO4 (compared to my WL results--which are close to the Oct averages in your chart).

For the chloride, the levels appear pretty consistent in your chart, but my testing was a bit higher. Looking at the WSSC tap water analysis for 2014, the average chloride content is 55mg/L--which is the highest monthly number in your chart. (it also varies from 26-233(!)) So perhaps the treatment by WSSC and Corbalis explains that difference. Had I used the October averages instead of my actual tested results, the difference would have been much smaller.

The Sulfate fluctuation is the significant finding, with a clear dip in the spring. That is why the additional gypsum was needed in the spring. I looked at the 2014 tap water analysis for WSSC, and they report an average of 36mg/L with a range of 10-94. But like you said, there's just max and min, not monthly numbers, so we can't discern whether the pattern matches.

I don't know why the sulfate is lower in the spring. I did a little looking online and its doesn't appear that MD uses any deicer that contains sulfate. Regardless, we should consider using a bit more gypsum in our spring brews.
Thanks for the data and then differences between your additions based on the monthly numbers. I agree the min and max range provided by the WSSC report is a little frightening. One thing is the WSSC report doesn't seem to specifiy if those are the numbers as they come in, or go out of, the plant - where Corbalis is leaving the plant numbers. Ya 2014 Chloride was a high average for WSSC and doesn't gel with the Corbalis data for that year. Though 2015 had that huge spike from March - April. I haven't done a whole lot of testing on beers and adjusting the Cl SO4 ratio, but from what Im thinking a little more chloride isn't as big of a deal as more sulfate.

The more I research the more I think certain beers I just wont use tap water for - like malty light beers. Hoppy beers seem to be ok especially if I end up adding gypsum most of the time anyways.
 
Yes, and they store it under those beehive things (lots used to get washed into the environment just from rain on the storage piles). But note from OP's data that the NaCl surge did occur in early spring (March) but only in the one year. I can't remember whether that was a particularly nasty winter or not.

That spike was earlier this year (2015) and the area did get quite a bit from february-March https://www.washingtonpost.com/news/capital-weather-gang/wp/2015/04/09/final-snowfall-total-map-for-2014-2015-another-overachieving-winter-in-the-d-c-area/
 
I think you're right to not worry about it when making hoppy beers. I mean, sulfate is the one that varies the most, and its a low of 22 and a high of 49. Here's what Palmer says about Sulfate:

"Brewing Range = 50-150 ppm for normally bitter beers, 150-350 ppm for very bitter beers"

Its easy to shoot for something in those ranges where 27 ppm one way or the other isn't a big deal. And that's the extreme case.


I see what you guys are saying. That does make sense.

But still, looking at the NaCl surge, it looks like it went to about 50 ppm Na, which is not a problematic amount. Bru'n says 0-150 is the normal range, but only go over 100 if there's high sulfate and most beers are better at 50 or lower. I don't generally add Na, so even at 50ppm during a surge I think its fine.

The chloride side of that is a bit different, surging up to 90. Bru'n says 10-100 is the preferred range but that you only want to approach the high end if there's a lot of sulfate. So even during a surge in NaCl you're okay with a hoppy beer that you're going high in sulfate anyway, but maybe not something maltier.

So then we're talking that you might need an adjustment if brewing a malty beer in the spring following a heavy winter. For me, that's rare enough, and temporary enough, that I probably wouldn't worry about it.
 
Back
Top