What I question personally is whether we should place much validity in their results when they expect John Q. Randomguy -- who might know little or nothing about beer -- to be able to detect differences between two beers at a 95% confidence level. But in my view, if we take a more loose approach and only expect John Q. as well as all the other various experienced tasters to detect a difference an average of maybe about 80% of the time,
You are confusing confidence level with preference level. If 10 out of 20 panelists qualify and 6 of them prefer beer B then we say "60% of qualified tasters preferred Beer B at the 2% confidence level. The confidence level is the probability that 6 or more would have preferred B given that A and B are indistinguishable and gives us the information we need to decide whether we think this data is a valid measurement of the beer/panel combination or just the result of random guesses necessitated by an unqualified panel or the fact that the beers are actually the same in quality. If the probability that the data we obtained came from random guesses is only 2% we are pretty confident that our data did
not come from random guesses and it is probably true that 60% or more of qualified tasters will prefer beer B.
Thus we can estimate that 60% of qualified tasters prefer a beer and we very confident (p < .001 ~ 0.1%) or moderately confident (p < 0.05 ~ 5%) or not too confident at all (p < 0.2 ~ 20%) that our observation of 6/10 wasn't arrived at through random events.
this experiment has 95% confidence that there seems to be a difference", then with an 80% bar instead of 95%, this lower bar is easier to meet or to "qualify" for further experimentation, rather than rehashing the same old "nope, we didn't achieve 'statistical significance' yet again". Statistically, if they only expect to be right about 80% of the time instead of 95%, the results reported should prove more interesting, at least in my own chumpy eyes.
The higher the confidence level the less likely we are to conclude that one beer is better. We want very small confidence level numbers. This makes us feel well, confident, that we can reject the hypothesis "This panel can't tell these beers apart".
There's more to it than just cofidence levels though. If we pick a certain confidence level (lets say p = 0.01 or 1% which is sort of midway between what is generally considered the largest acceptable value (0.05) and what is often considered the lowest level of interest (p = 0.001) it has implications on how well our test will perform. Overall, recall, that we have made some change to our brewing process and want to know whether this makes better beer. Before we can perform any experiments we must define what 'better' means. For the purposes of the current discussion suffice it to say that
'better' means preferred by more 'qualified' tasters than a beer which is not so good. This, of course, requires definition of 'qualified' and there has been discussion of that. So if we have beer A, beer B and beer C with A preferred by 60% of tasters, B preferred by 70% of tasters and C preferred by 85% of tasters we say that B is better beer than A and C is a better beer than A or B. It should not come as a surprise that the performance of a test depends on the strength of the goodness but it also depends on the design of the test and the threshold we choose. The way we describe performance of a test comes from the RADAR engineers of WWII. A RADAR set sends out RF energy and measures the strength of the signal over time. If the received signal is strong enough to exceed a threshold (under control of the operator in the early days) we decide a target is present and if it doesn't we decide no target is present at the range and azimuth to which the set is listening. The operators threshold control is relative to the noise level inherent in the environment. If the operator sets the threshold at the noise level then noise related voltages will be above the threshold a large proportion of the time and the scope will fill up with 'false alarms' that is, detection decisions made when there is no target present. If he sets the threshold well above the noise only the strongest signals will exceed it and returns from smaller ones will not be detected (false dismissal). In the beer test target detection is the conclusion that one beer is better given the data (voltage) we obtain from the test. A good test gets more 'signal' from the beer relative to the noise which is caused by panelists inability to be perfect tasters or the inclusion of panelists less qualified than we might like and by the fact that some beers are only a little better than others while some are much better than others.
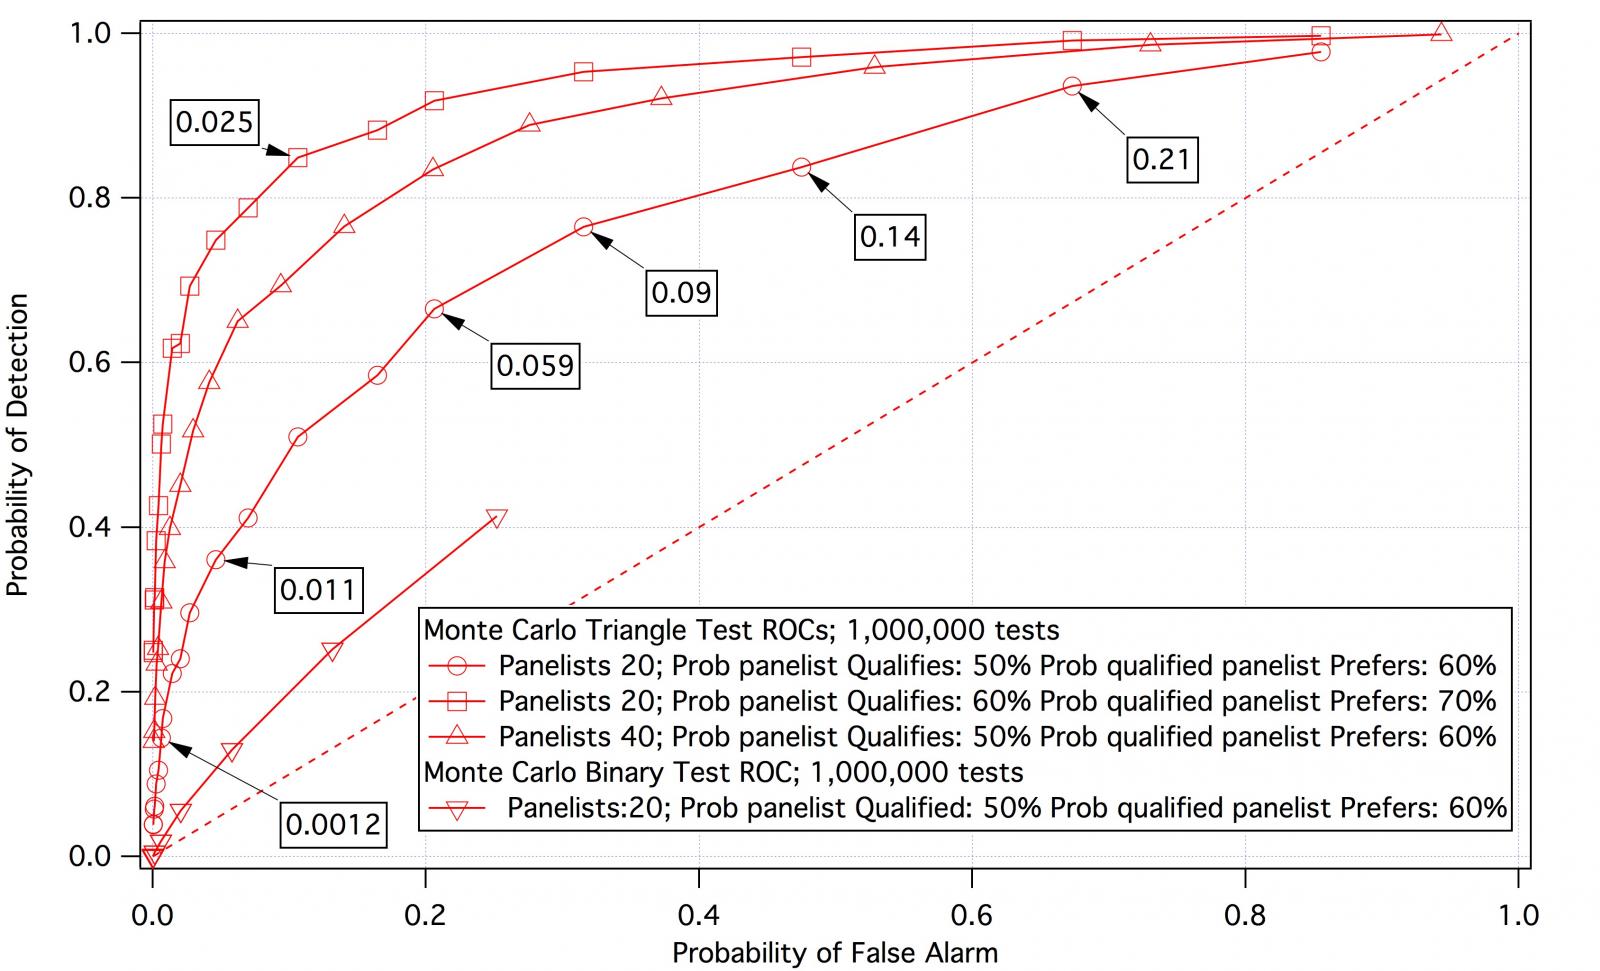
The performance of a test against a particular signal in a particular noise environment is well represented by a "Receiver Operation Characteristic" which is a curve like the ones on the graph. The curve with the open circles represents the performance of a triangle test with 20 panelists. The probability that a panelist is qualified is 50% and the probability that the modified beer is better than the unmodified is 60%. The vertical axis shows the probability that such a test will find the beer better for each point on the curve which is labeled with the value of p used to reject the null hypothesis (the confidence level). At the left end of the curve we demand that the probability of random generation of the observed data is very small. Under those conditions we do not detect better beer very readily. At the other end we accept decisions based on little confidence (high p) and thus detection is almost certain.
The horizontal axis shows the probability that we will accept that the beer is better given that it isn't (false alarm). Thus, as with the RADAR, the probability of detecting the hypothesis "The doctored beer is better" becomes higher with reduced threshold whether the beer is actually better or not.
The point at the upper left hand corner represents the point where the probability of detection is 1 and the probability of false alarm is 0. This represents a perfect receiver (test). The closer one is to that point the better the test for the given beer. This makes it clear that one's choice of threshold should be the one that gets us closest to that corner ( p = 0.059 for the circle curve). But that may not be the case. In medicine, for example, the cost of missing a diagnosis may be high (the patient dies and the doctor gets sued) whereas, on the other hand, having a high false alarm rate is not such a bad thing as the expected loss from a malpractice suit goes down while at the same time he can charge for additional tests to see if indeed the patient does have the disease. Threshold choice is often determined by such considerations. In broad terms, the farther away the ROC curve is from the dashed line, the better the test.
The curve with inverted triangles is the ROC for the test mongoose suggested would be better than a triangle test given the same parameters as the curve with circles i.e. 20 panelists with the probability that a panelist qualifies being 50% and the beer better at the 60% level. The curve with the triangles shows the effect of increasing the panel size to 40 and the curve with squares the effect of making the beer more preferable increasing, there fore, the panel's ability to distinguish.
I'm not going to say more in this post as I expect I'll be coming back to this.


![Craft A Brew - Safale BE-256 Yeast - Fermentis - Belgian Ale Dry Yeast - For Belgian & Strong Ales - Ingredients for Home Brewing - Beer Making Supplies - [3 Pack]](https://m.media-amazon.com/images/I/51bcKEwQmWL._SL500_.jpg)


